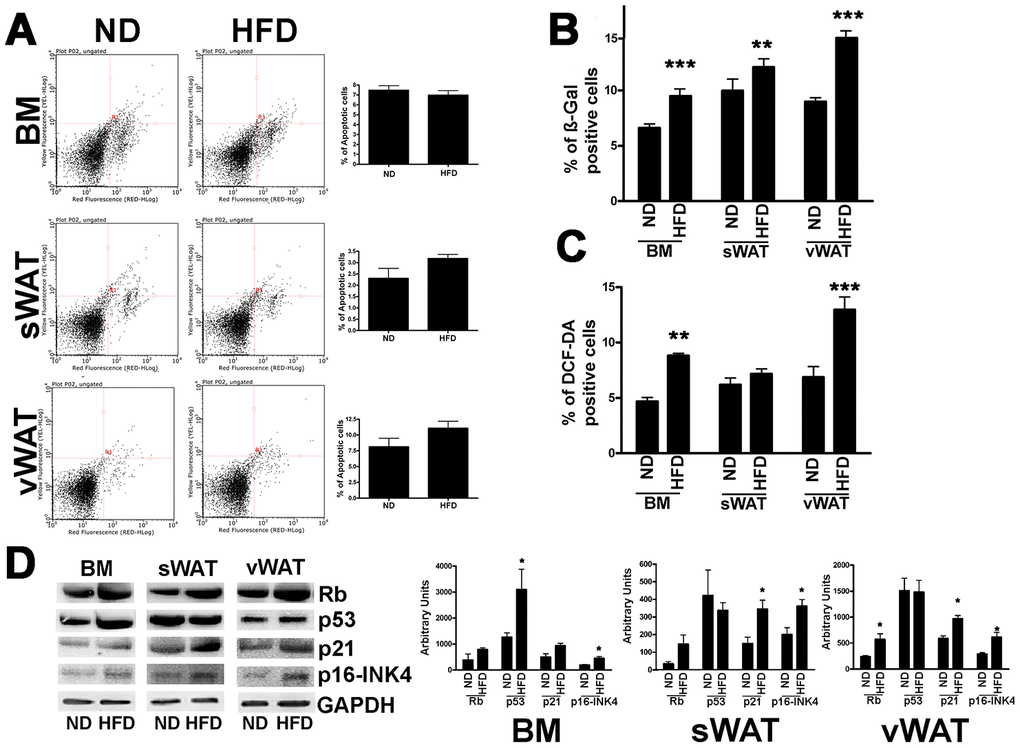
Figure 3.Apoptosis and senescence in MSCs from obese and control animals. (A) Representative FACS analysis of MSC apoptosis. The assay identifies early (Annexin V + and 7ADD −) and late apoptosis (Annexin V + and 7ADD +). Apoptosis is a continuous process and we calculated the percentage of apoptosis as the sum of early and late apoptotic cells. The histogram shows the mean percentage of Annexin V-positive cells. Data are expressed with standard deviation (n=6 animals for each experimental condition). (B) The graph shows mean percentage value of senescent cells determined by SPiDER-ßgal assay. Data are expressed with SD (n=6 animals for each experimental condition) **p<0.01, ***p<0.001. (C) The graph shows mean percentage value of cells showing discrete amount of intracellular ROS that are above the threshold detected by H2DCFDA assay. Data are expressed with SD (n=6 animals for each experimental condition) **p<0.01, ***p<0.001. (D) Western blot analysis of proteins regulating senescence. The picture shows a representative blot analysis the expression levels of Rb, p53, p21, p16/INK4, Gapdh (loading control). The graph shows mean expression levels (±SD, n = 6 biological replicates, *p<0.05).