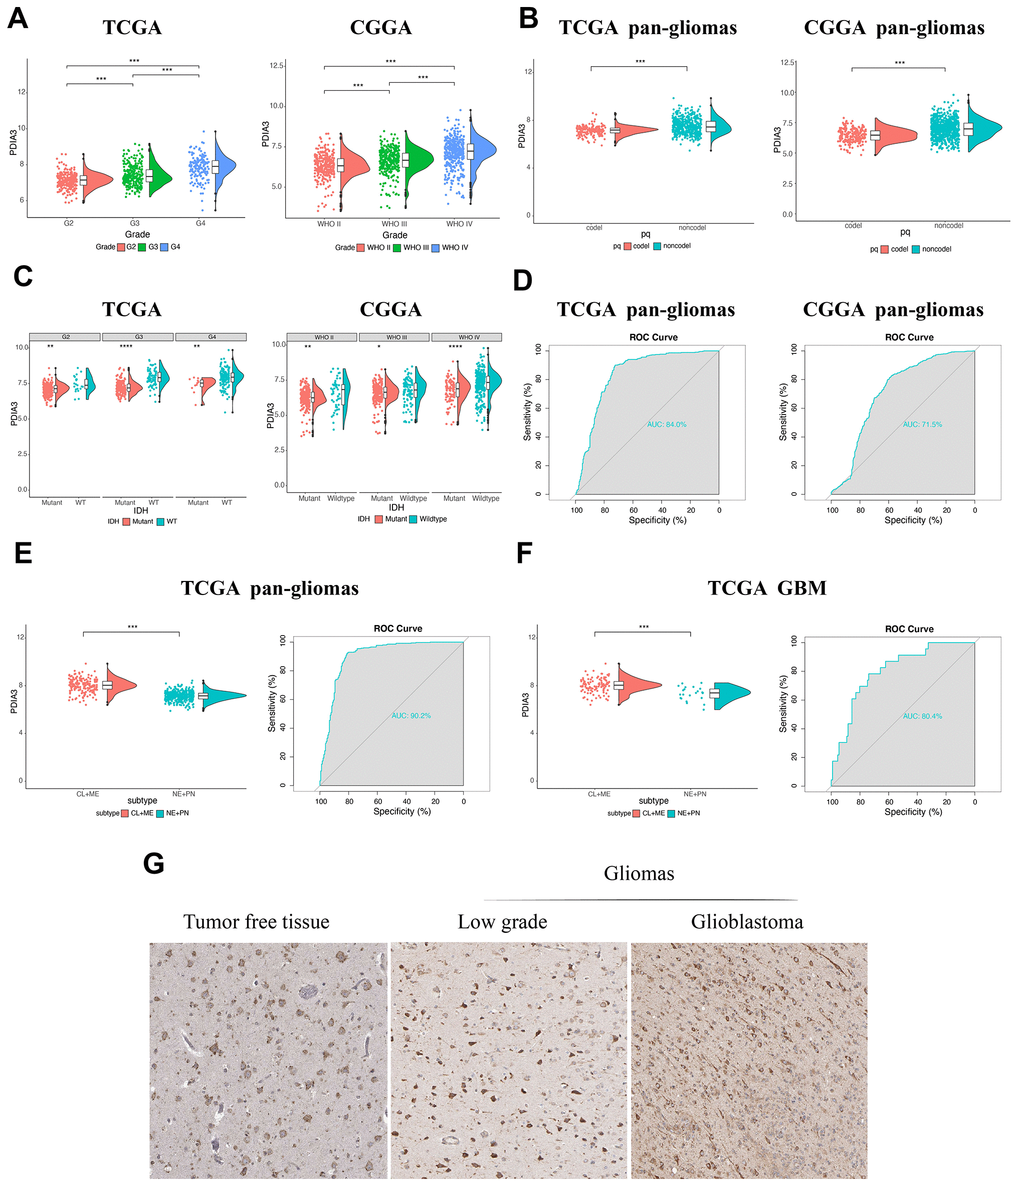
Figure 1.The relationship between PDIA3 expression and various characteristics. (A) PDIA3 expression in different WHO grades from TCGA and CGGA. (B) PDIA3 was upregulated in 1p/19q non-codeletion cases. (C) PDIA3 expression in different IDH state from TCGA and CGGA dataset. (D) ROC curve analysis showed that PDIA3 had 84.0% and 71.5% sensitivity and specificity to predict IDH wild-type state gliomas in TCGA and CGGA, respectively. (E) The PDIA3 expression pattern in pan-gliomas based on TCGA molecular subtypes. ROC curves showed PDIA3 as a predictor of more aggressive subtype gliomas. (F) The PDIA3 expression pattern in GBM from the TCGA molecular subtype. ROC curve analysis showed that PDIA3 had 80.4% sensitivity and specificity to predict more aggressive subtype gliomas. (G) PDIA3 has higher expression in GBM than in LGG at the protein level. *P < .05, **P < .01, ***P < .001.