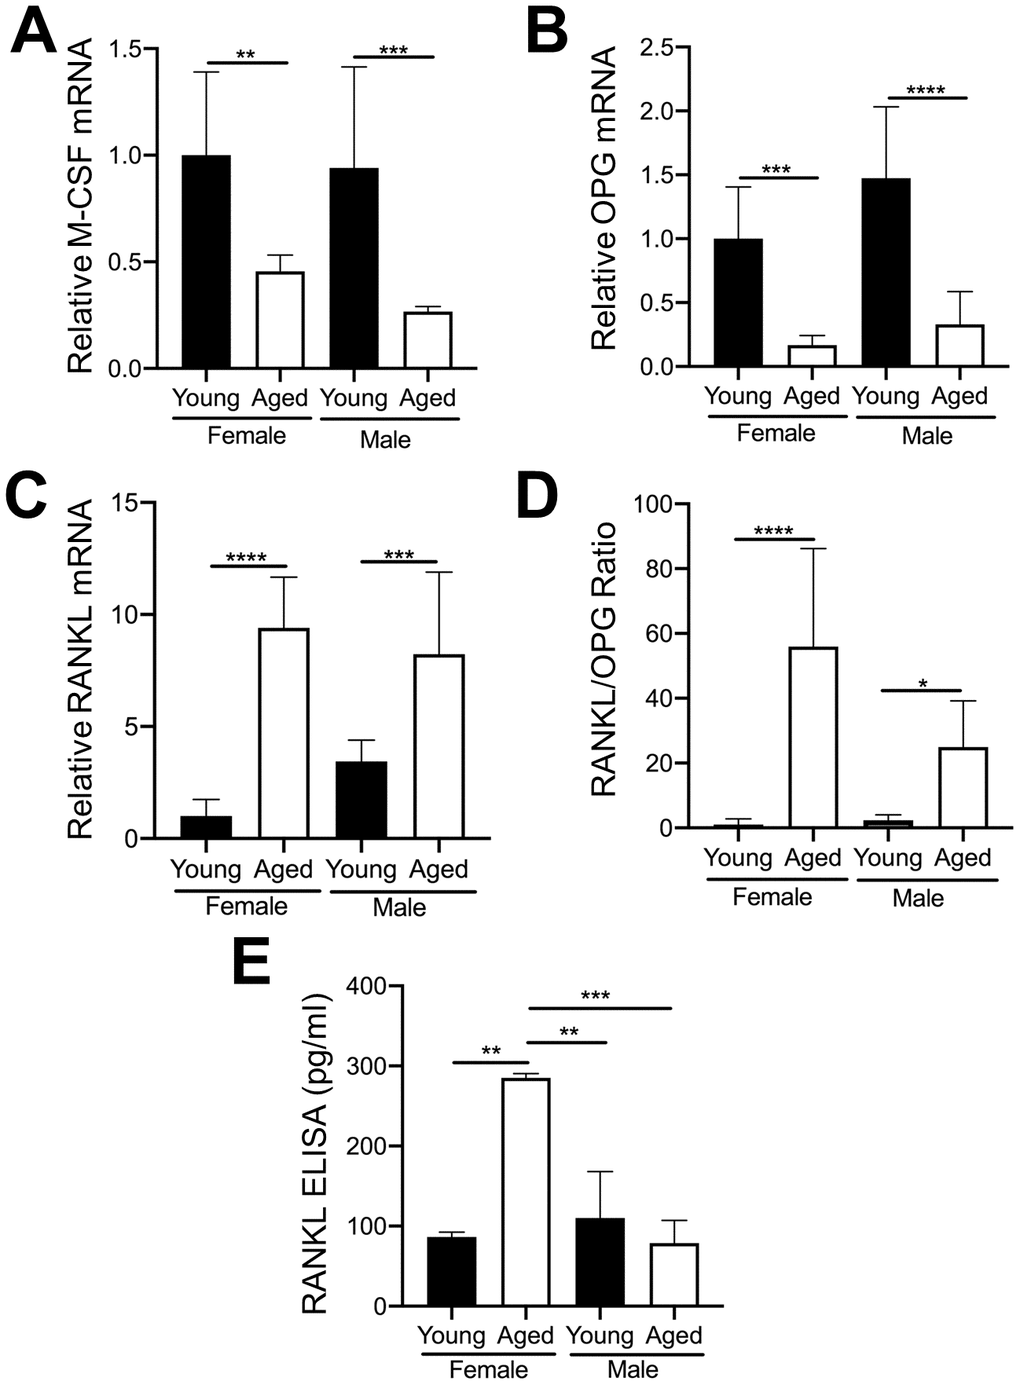
Figure 6.Expression of key OC factors in MKs from young and aged mice. (A–D) MKs were prepared from the bone marrow of young and aged, male and female mice using a BSA gradient and used for mRNA expression analyses by real-time PCR. (A) M-CSF mRNA (Ct cycle range was 25.2–30.12). (B) OPG mRNA (Ct range 35.09–39.53). (C) RANKL mRNA (Ct range 28.6–35.5). (D) The RANKL/OPG ratio was calculated for young and aged, male and female MKs (N=4-5/group). (E) RANKL concentrations in MK CM was quantified by ELISA. MK CM from aged females was significantly higher than MK CM from young females. P-values were calculated by one-way ANOVA followed by Tukey’s post-hoc test and the data are presented as mean ± SD. (*p<0.05, **p<0.01, ***p<0.001, ****p<0.0001).