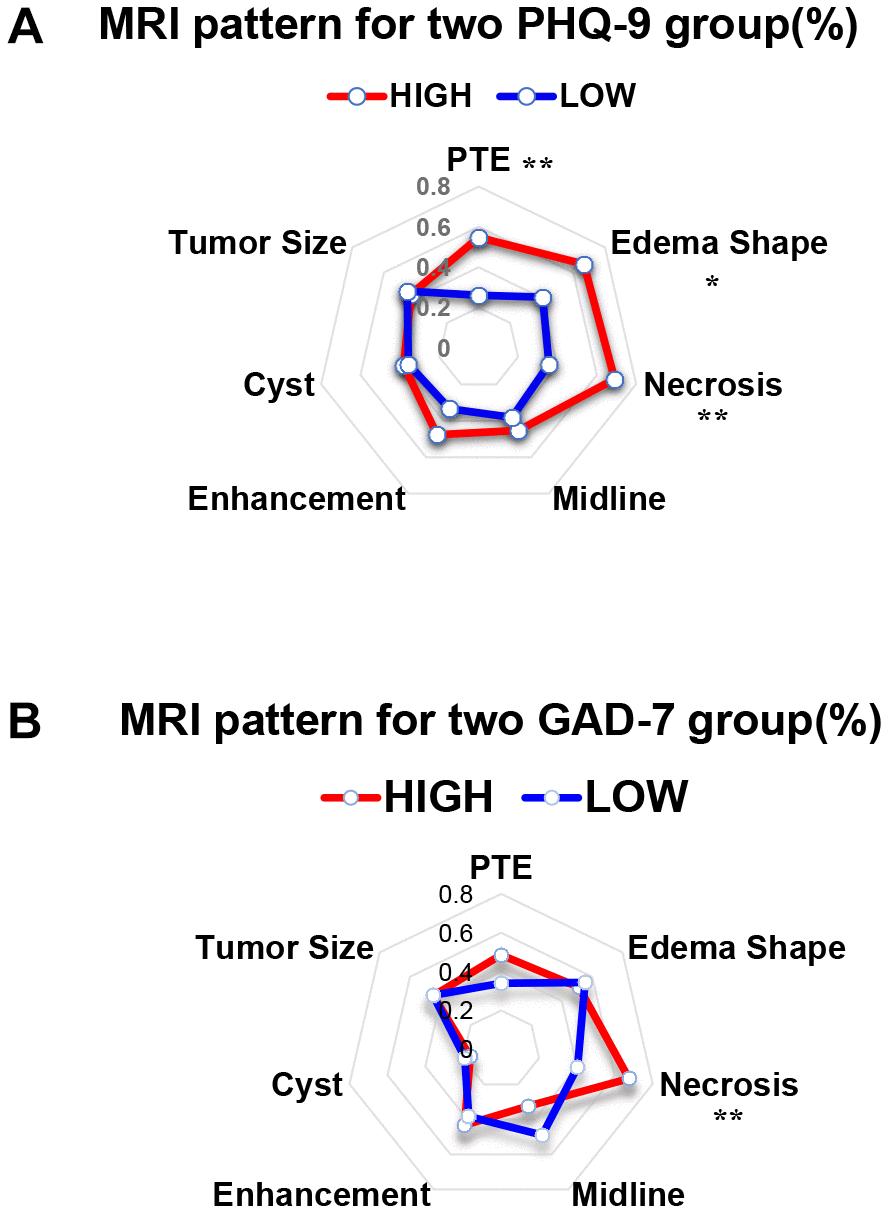
Figure 3.The MRI results of patients with different PHQ-9 and GAD-7 scores presented different features. (A) Radar chart showing the MRI features of the high and low PHQ-9 groups. Chi-squared analysis was conducted as the statistical method. **, P < 0.01; *, P < 0.05. (B) Radar chart showing the MRI features of the high and low GAD-7 groups. Chi-squared analysis was conducted as the statistical method. **, P < 0.01.