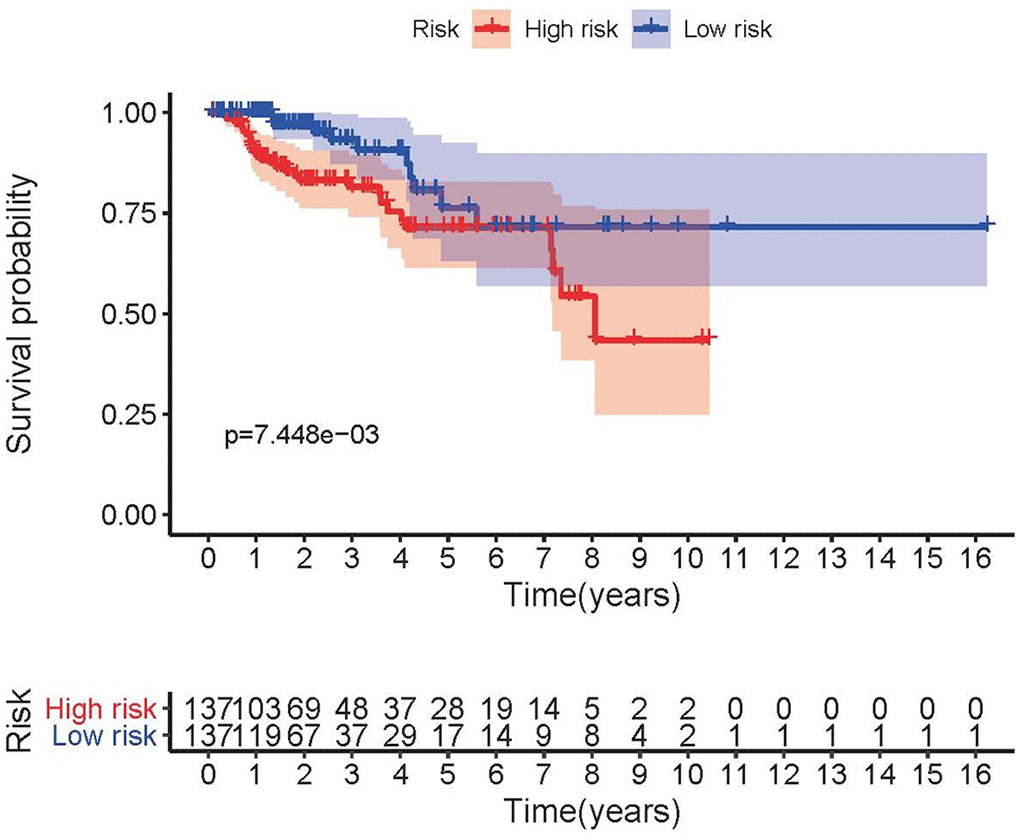
Figure 3.Survival curve of pRCC patients. Kaplan-Meier survival curve of OS among pRCC patients from the low-risk group and the high-risk group. The high-risk group showed the poorer prognosis.
Figure 3 — Bioinformatics profiling integrating a four immune-related long non-coding RNAs signature as a prognostic model for papillary renal cell carcinoma | Aging