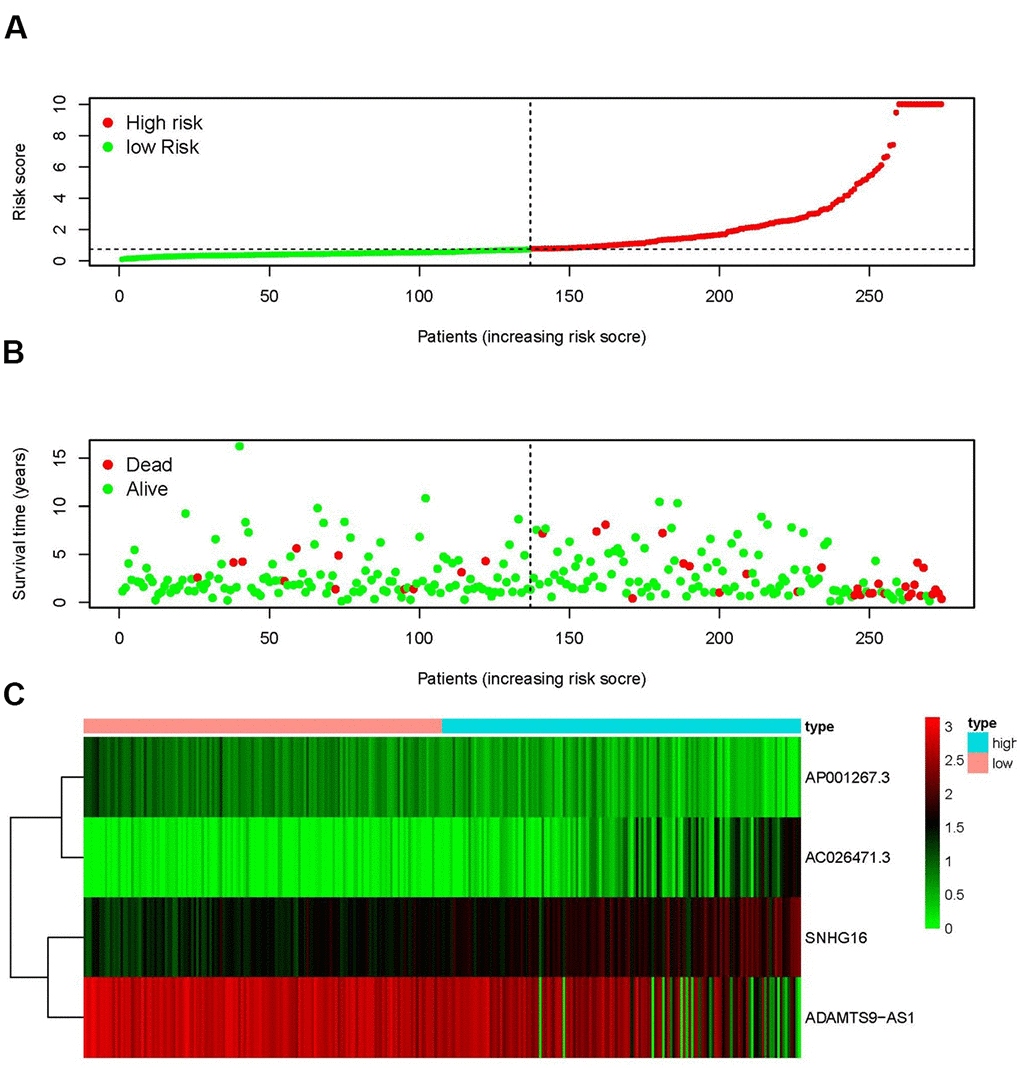
Figure 2.IRRS was established according to sIRlncRs. Distribution of risk score in the high-risk group and the low-risk group (A). Survival status between the high-risk group and the low-risk group (B). The heatmap of expression profile of contained sIRlncRs (C). In the heatmap, red parts represent up-regulation, green parts represent down-regulation, and black parts represent sIRlncRs without differential expression.