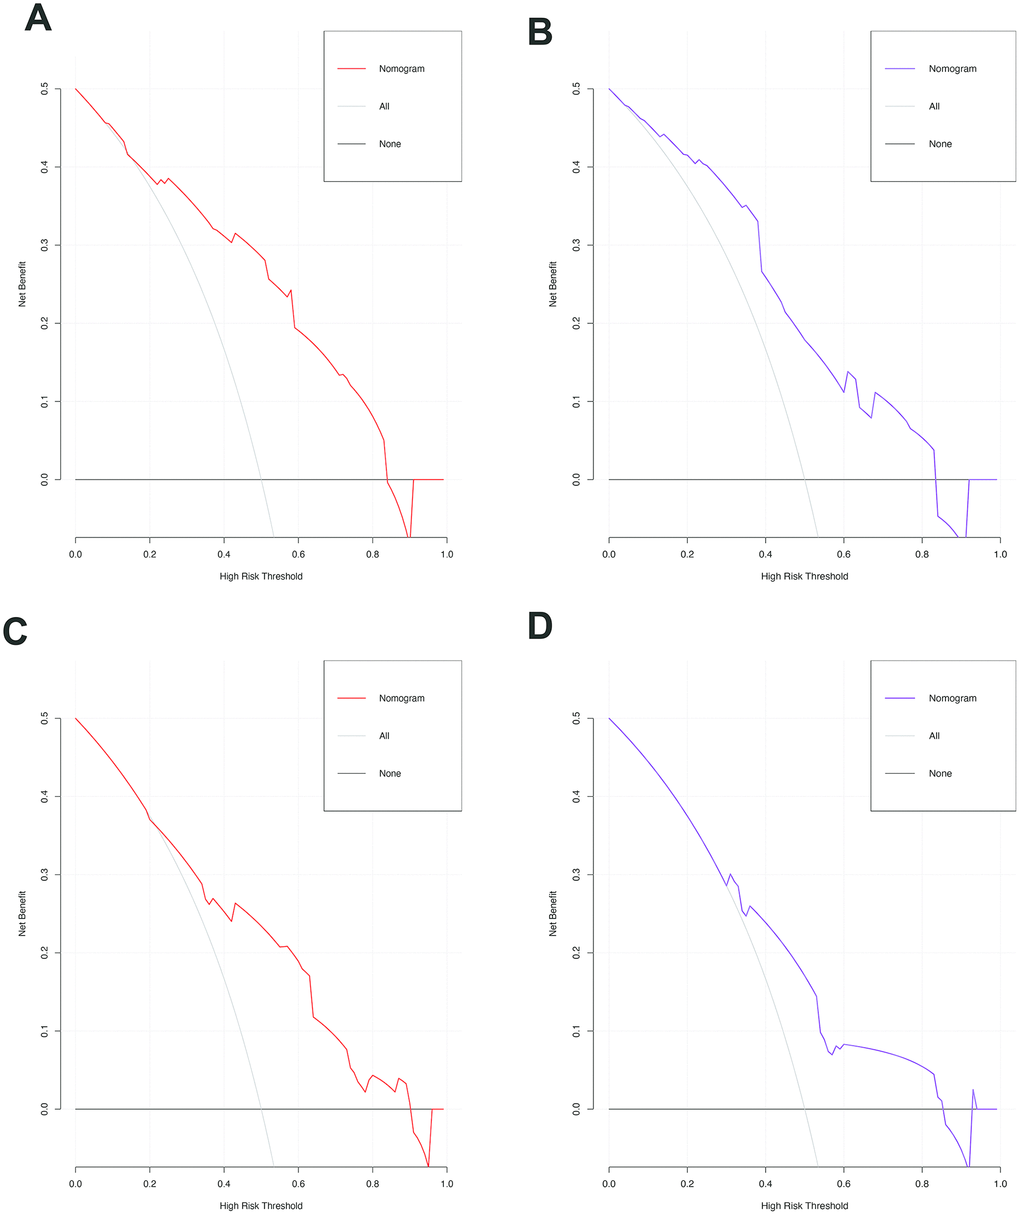
Figure 5.The decision curves of the nomograms for predicting the presence of SAT and MVI in the training (A, C) and validation sets (B, D). The Y-axis represents the net benefit. The X-axis shows the threshold probability. The horizontal solid black line represents the hypothesis that no patients experienced presence of SAT or MVI, and the solid gray line represents the hypothesis that all patients met the endpoint.