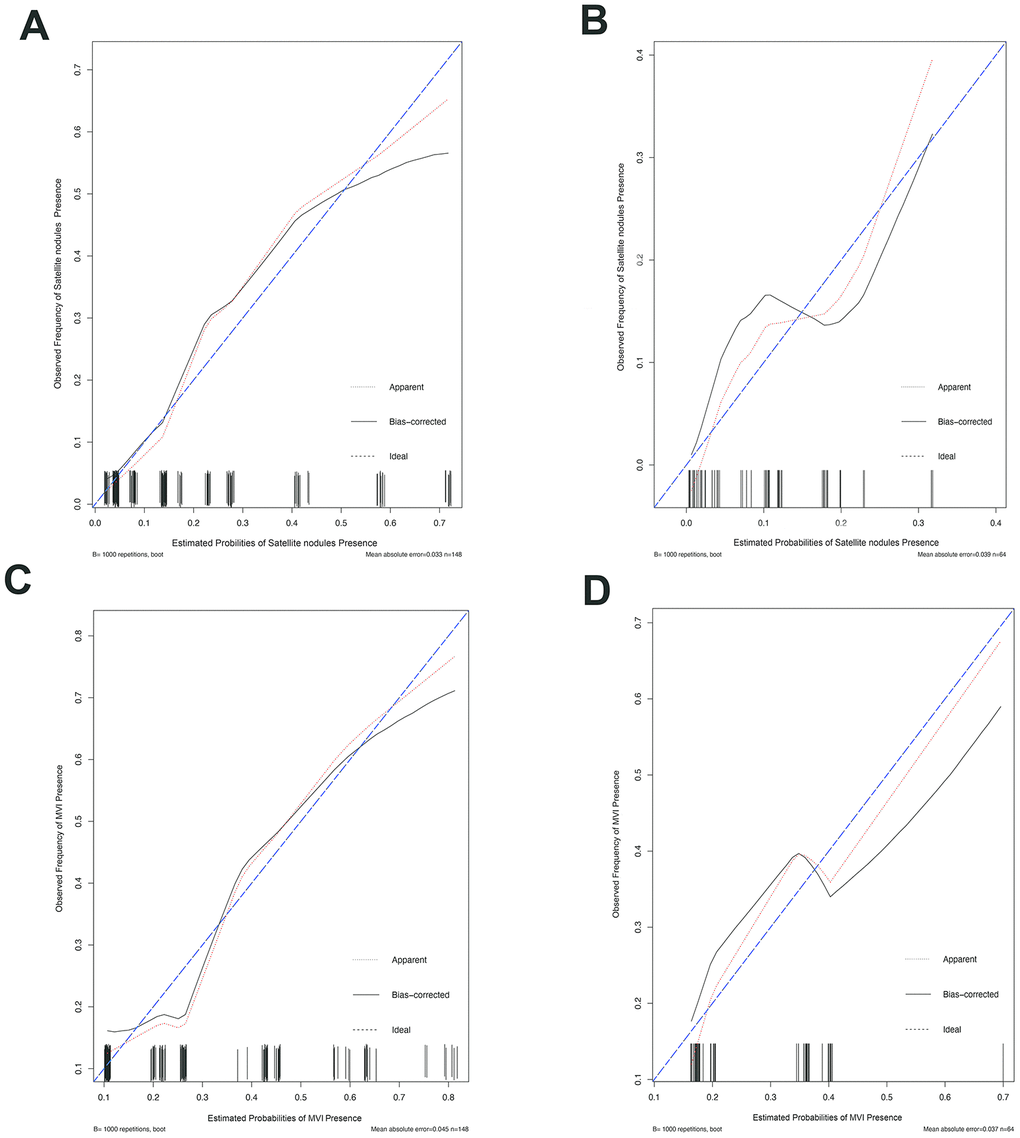
Figure 4.The calibration curve for predicting patient MVI and SAT in the training set and in the validation set. The C-index value for the nomogram predicting satellite nodules was 0.826 (95% CI, 0.743 to 0.909) for the training set (A) and 0.778(95% CI, 0.630 to 0.926) for the validation set (B), while the C-index value for the nomogram predicting MVI was 0.771 (95% CI, 0.688 to 0.854) for the training set (C) and 0.702 (95% CI, 0.572 to 0.832) for the validation set (D). Ideal line (blue), estimated probabilities correspond to the actual observation; apparent line (red), predictive capability of the model obtained after data analysis; bias-corrected line, predictive capability of the model obtained after bootstrap correction.