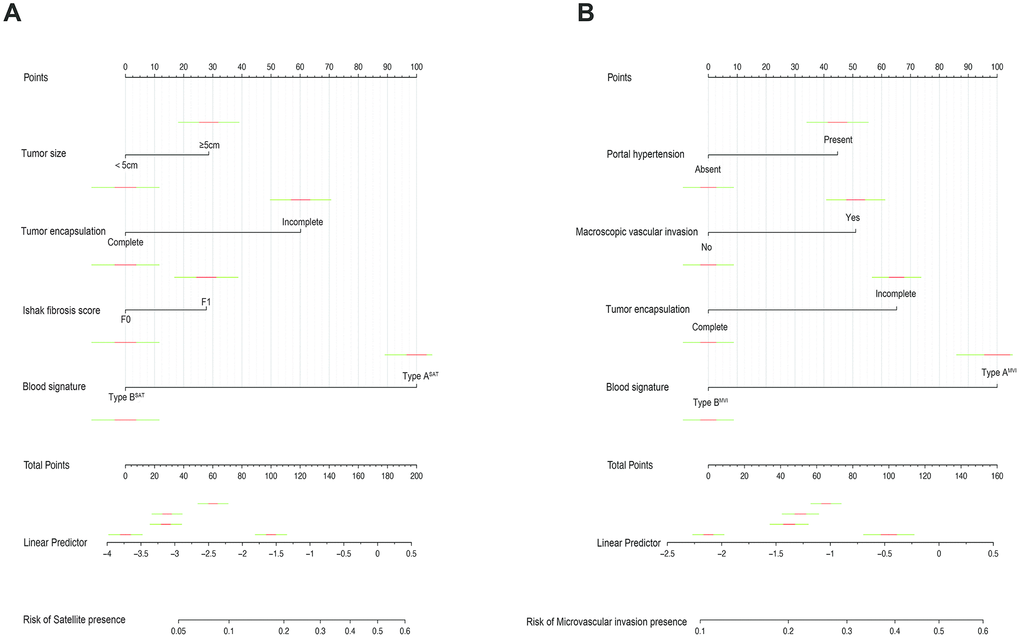
Figure 3.Nomograms for predicting SAT and MVI and the calibration plot. (A). The nomogram maps the predicted probability of SAT on a scale of 0 to 200. (B). The nomogram maps the predicted probability of MVI on a scale of 0 to 160. For each covariate, a vertical line is drawn upwards and the corresponding points are noted. This is repeated for each covariate, ending with a total score that corresponds to a predicted probability of SAT or MVI at the bottom of the nomogram.