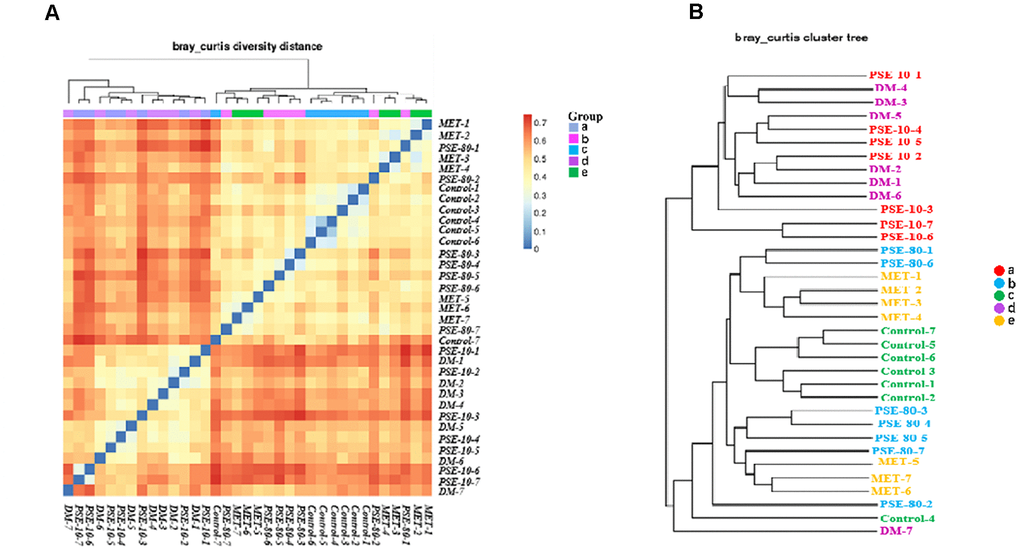
Figure 5.Effect of PSE on gut microflora of type 2 diabetic mice-induced by high-fat diet. The Bray Curtis heatmap of beta diversity analysis (A) and cluster analysis results of species composition (B). Letters a, b, c, d, and e in the graph represent the 10 mg/kg PSE-treated, 80 mg/kg PSE-treated, normal control, diabetes mellitus, and 140 mg/kg MET-treated groups, respectively.