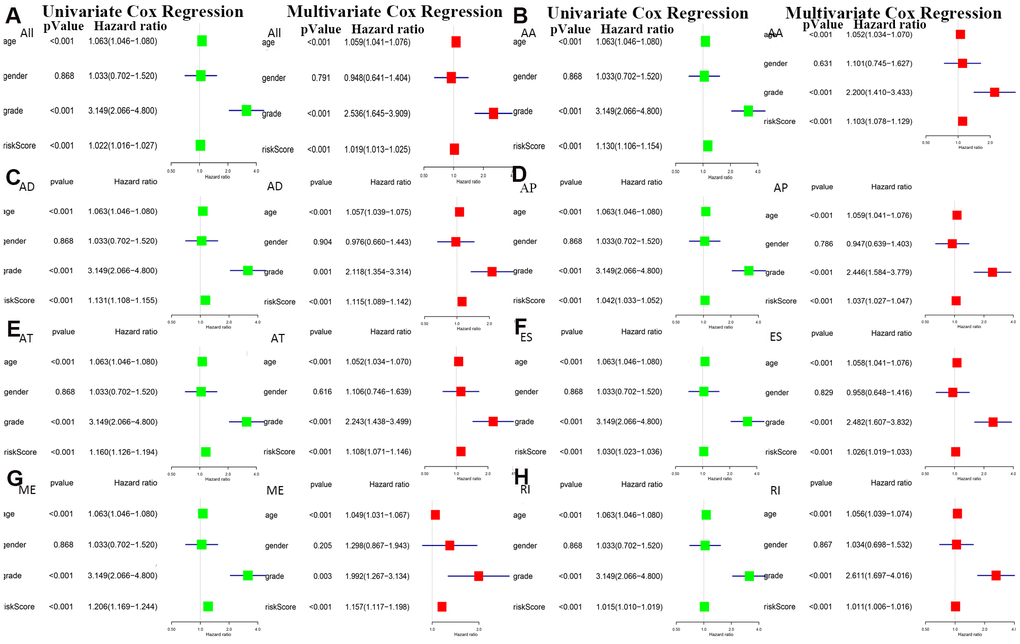
Figure 6.Univariate and multivariate Cox regression analyses of prognosis-related AS events in 8 groups were performed in forest plots of (A) all types of AS events, (B) AA, (C) AD, (D) AP, (E) AT, (F) ES, (G) ME and (H) RI (P < 0.05).
Figure 6 — Genome-wide analyses of the prognosis-related mRNA alternative splicing landscape and novel splicing factors based on large-scale low grade glioma cohort | Aging