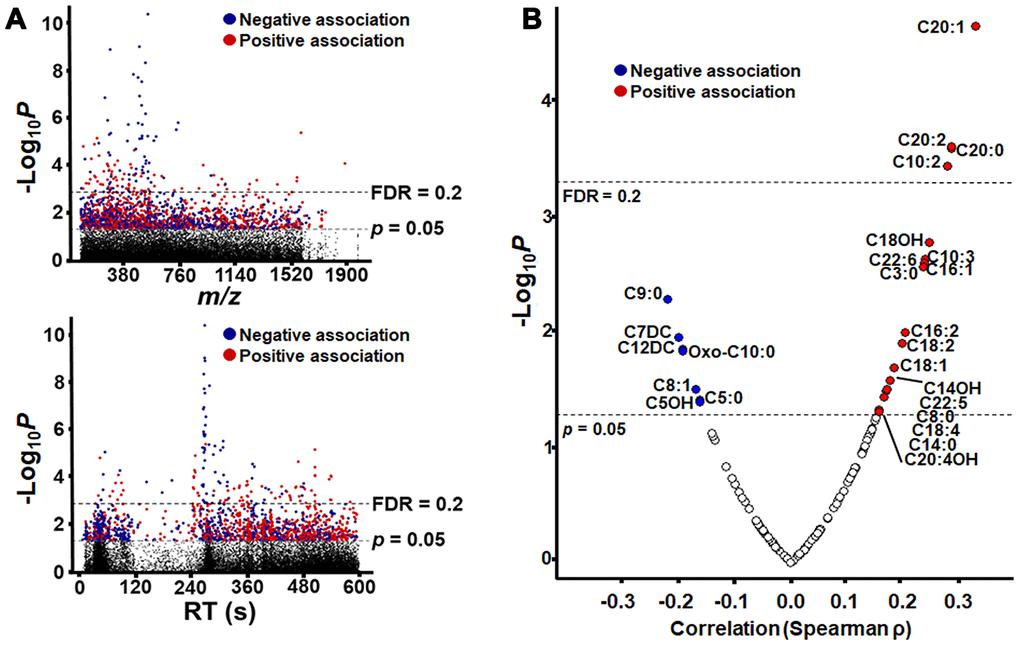
Figure 2.Metabolome-Wide Association Study (MWAS) of plasma metabolites correlated with age. (A) Type 1 Manhattan plot showing -log10p for correlation of each metabolite plotted by m/z (mass-to-charge ratio) and type 2 Manhattan plot showing -log10p for correlation of each metabolite plotted by chromatographic retention time (RT) in seconds, as separated the C18 column. Plots are shown with significance (n = 1505, p = 0.05) and false discovery rate (n= 140, FDR = 0.2) thresholds by dashed lines, and the detailed information of metabolic features is provided in Supplementary Table 1. (B) Plot of acylcarnitine correlation strength and direction (Spearman ρ) by –Log10 p. Acylcarnitines with p < 0.05 are labeled by the chain length, saturation and modification of the acyl group (see Table 1 for details). For acylcarnitines detected on both C18 and anion exchange columns, only the C18 data is represented in the plot. The plot is shown with significance (n = 26, p = 0.05) and false discovery rate (n= 4, FDR = 0.2) thresholds by dashed lines In all plots, significant negative correlations are shown in blue, and significant positive correlations are shown in red.