Submit an Article
Navigate
Home
Editorial Board
Editorial Policies
Current Volume
Archive
Scientific Integrity
Publication Ethics Statements
Interviews with Outstanding Authors
Newsroom
Sponsored Conferences
Podcast
Contact
Special Collections
Submit an Article
Online ISSN: 1945-4589
Research Paper
|
Volume 12, Issue 14
|
pp. 14244–14270
Efficacy and safety of therapies for EGFR-mutant non-small cell lung cancer with brain metastasis: an evidence-based Bayesian network pooled study of multivariable survival analyses
Back to article
Figure 3
(3 of 3)
−
100%
+
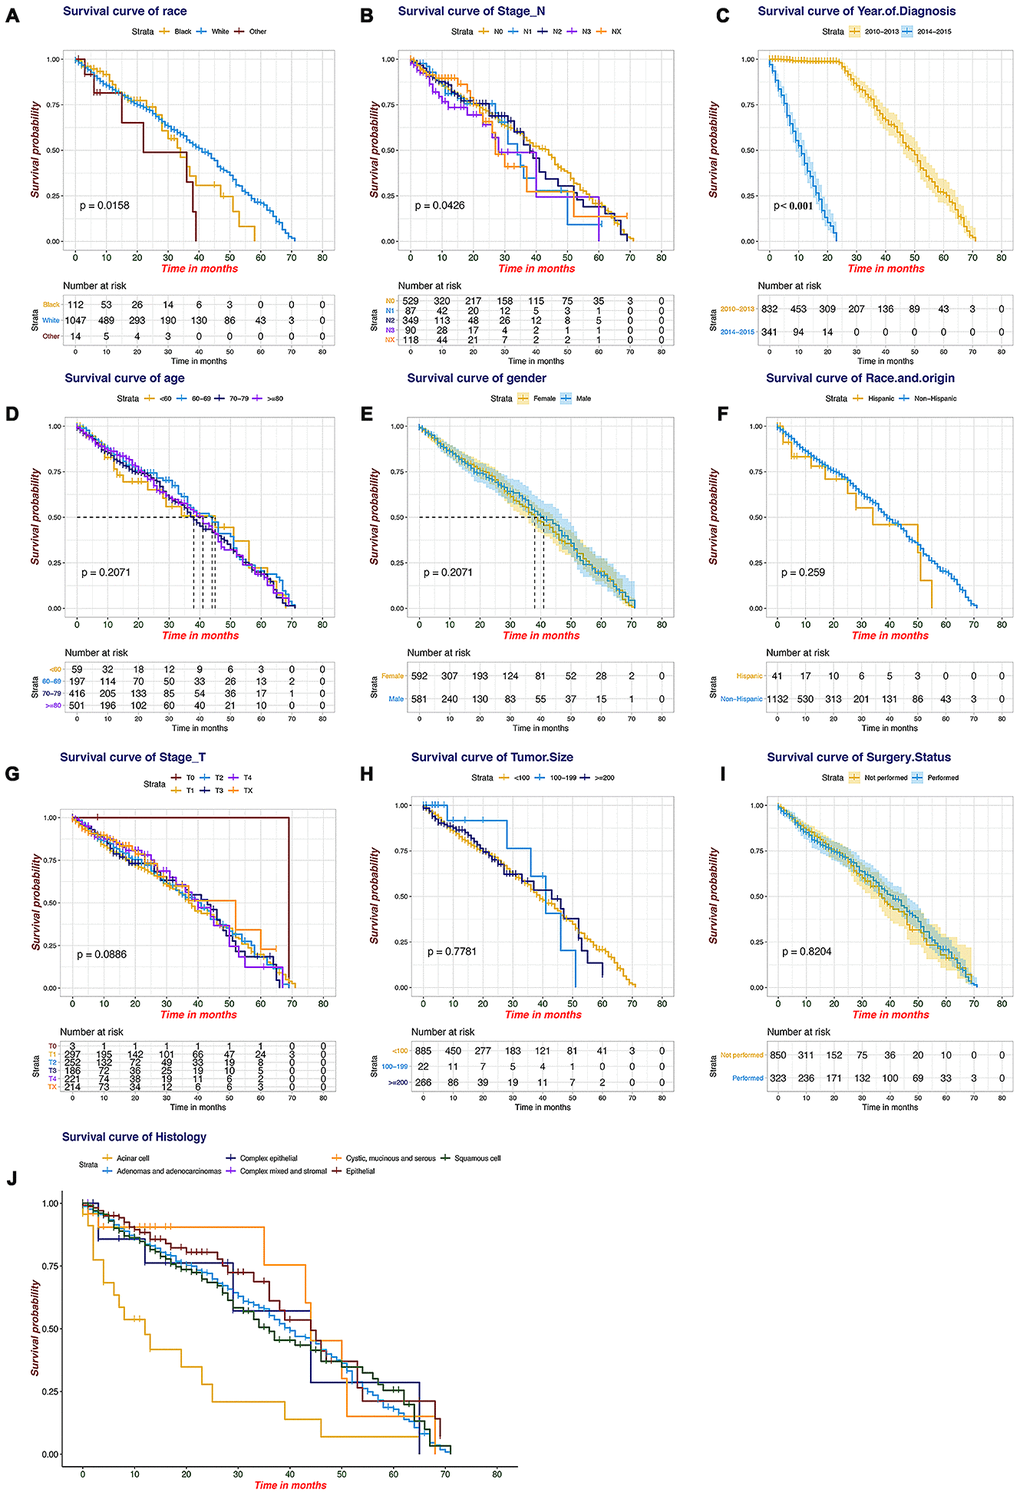
Figure 3.
Kaplan-Meier plots for the survival of the SEER patients.
(
A
) Race, (
B
) stage_N, (
C
) year of diagnosis, (
D
) age, (
E
) gender, (
F
) race and origin, (
G
) stage_T, (
H
) tumour size, (
I
) surgery status, (
J
) histology.