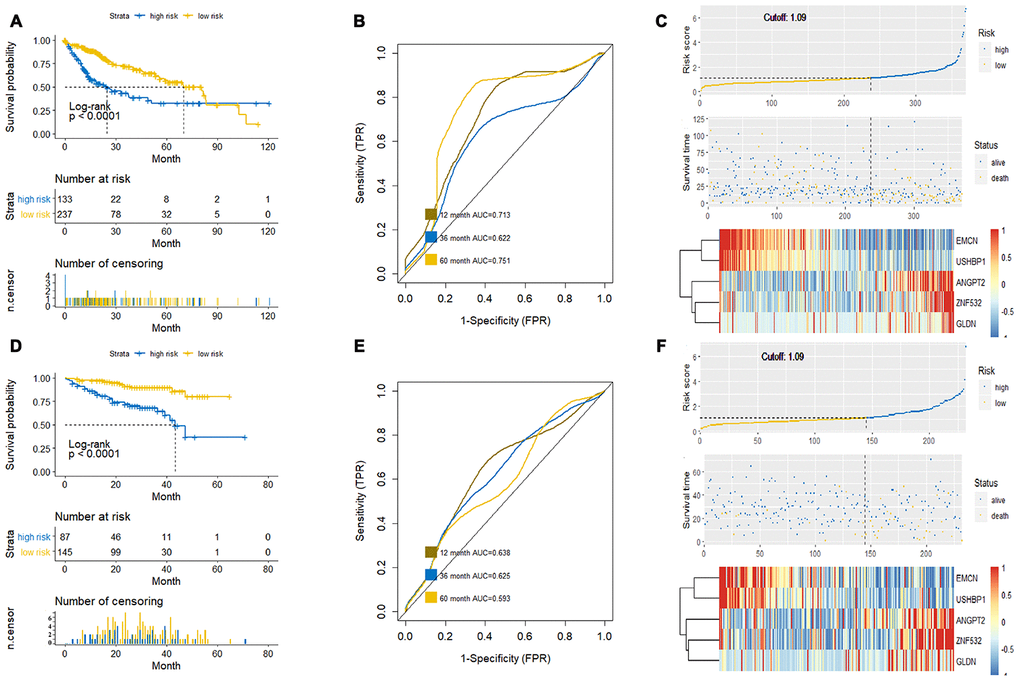
Figure 5.Verification of the prognostic prediction accuracy of the new survival model. (A, C) The Kaplan-Meier survival curve (A), ROC curve (B) and Risk curve (C) analyses of the high-risk and low-risk HCC patients of the training dataset from the TCGA database based on the new survival model is shown. (D–F) The Kaplan-Meier survival curve (D), ROC curve (E) and Risk curve (F) of the high-risk and low-risk HCC patients in the test dataset from the ICGC database based on the new survival model is shown. The horizontal axis of the Kaplan-Meier survival curve is survival time (month) and the vertical axis is patient survival, which is used to evaluate the prognostic prediction ability of the new model (P < 0.05 is considered to be statistically significant); the ROC curve evaluates the sensitivity and specificity of the model, in which the Abscissa is the specificity of the model and the ordinate is the sensitivity; moreover, the risk curve shows that the risk of death increases with the increase of the risk score of the new survival model.