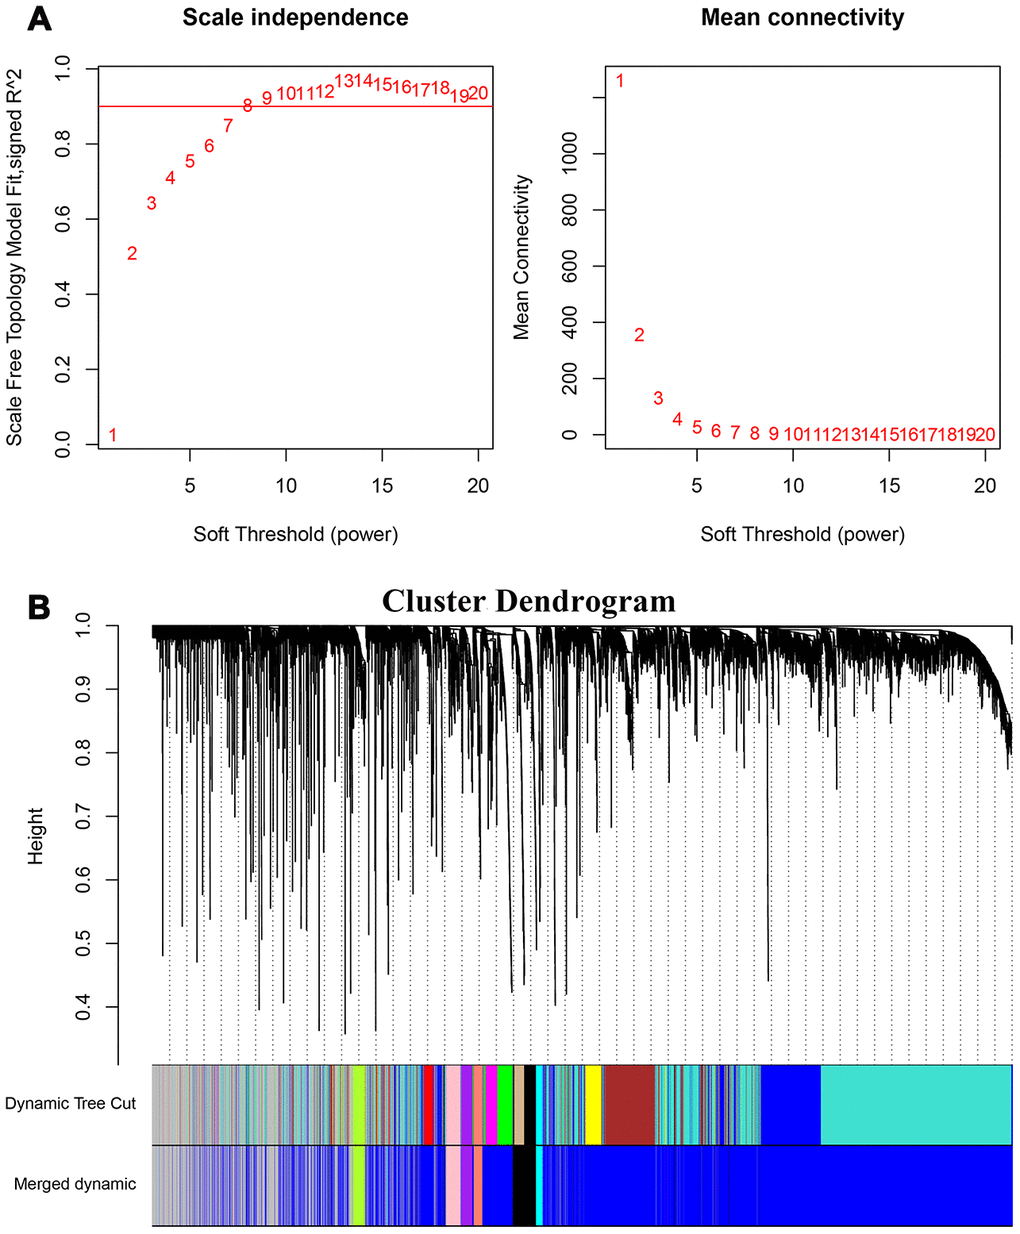
Figure 3.Weighted gene co-expression network analysis of HCC transcriptome. (A) The graph shows the scale-free fit index for various soft threshold powers to identify the optimal soft threshold power (β). In the graph on the left, the horizontal axis represents the soft threshold power or β values and the vertical axis represents the scale-free network index (R2). The scale-free characteristics of the gene network are stronger when the R2 value is higher. In the right graph, the horizontal axis represents the soft threshold power or β values, the vertical axis represents the means of all the gene adjacency functions in the corresponding gene module. (B) Identification of co-expressed gene modules in HCC. The different branches of the cluster dendrogram correspond to different gene modules that are represented by different colors. Each piece of the leaves corresponds to a single gene in the module.