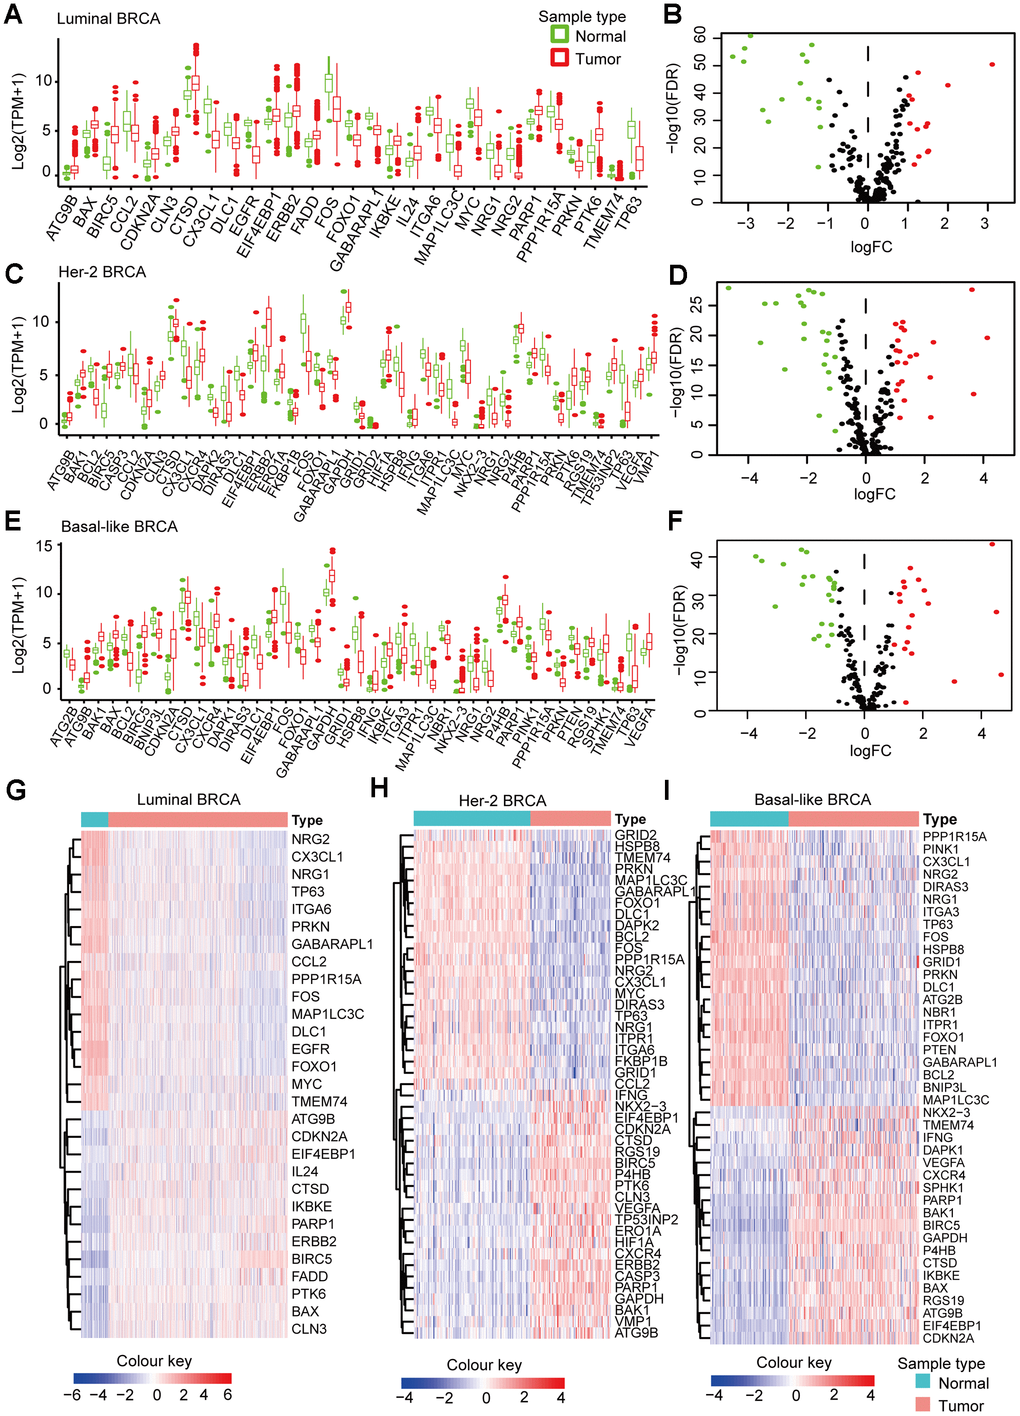
Figure 2.Subtype-specific DEARGs in BRCA and normal breast tissues. (A) Boxplot showing the expression pattern of DEARGs in Luminal BRCA. (B) Volcano plot for the 234 ARGs in Luminal BRCA. (C) Boxplot showing the expression pattern of DEARGs in Her-2 BRCA. (D) Volcano plot for the 234 ARGs in Her-2 BRCA. (E) Boxplot showing the expression pattern of DEARGs in Basal-like BRCA. (F) Volcano plot for the 234 ARGs in Basal-like BRCA. The upregulated, downregulated and no-differential expressed genes were indicated by green, red and black dots, respectively. The P-value was calculated by Wilcox-test. (G–I) Clustered heatmap of differentially expressed ARGs expression level in Luminal (G), Her-2 (H) and Basal-like (I) BRCA.