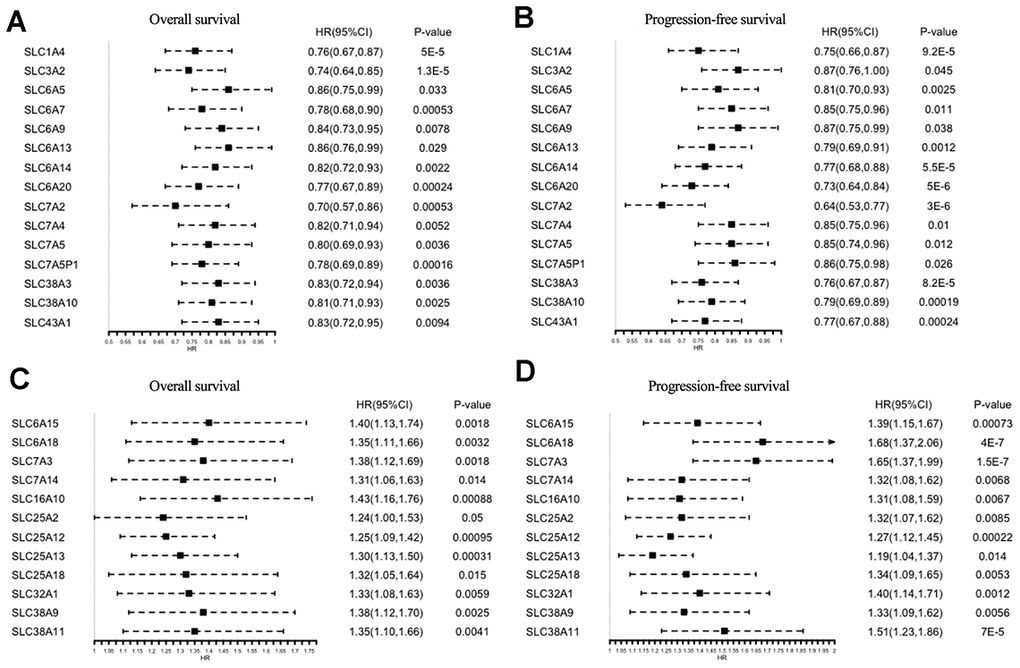
Figure 3.Prognostic values of SLC family members in ovarian cancer (Kaplan–Meier Plotter). (A, B) HRs of prognostic protective SLC family members in ovarian cancer. (C, D) HRs of prognostic risk SLC family members in ovarian cancer. SLC, solute carrier; HR, hazard ratio; CI, confidence interval.