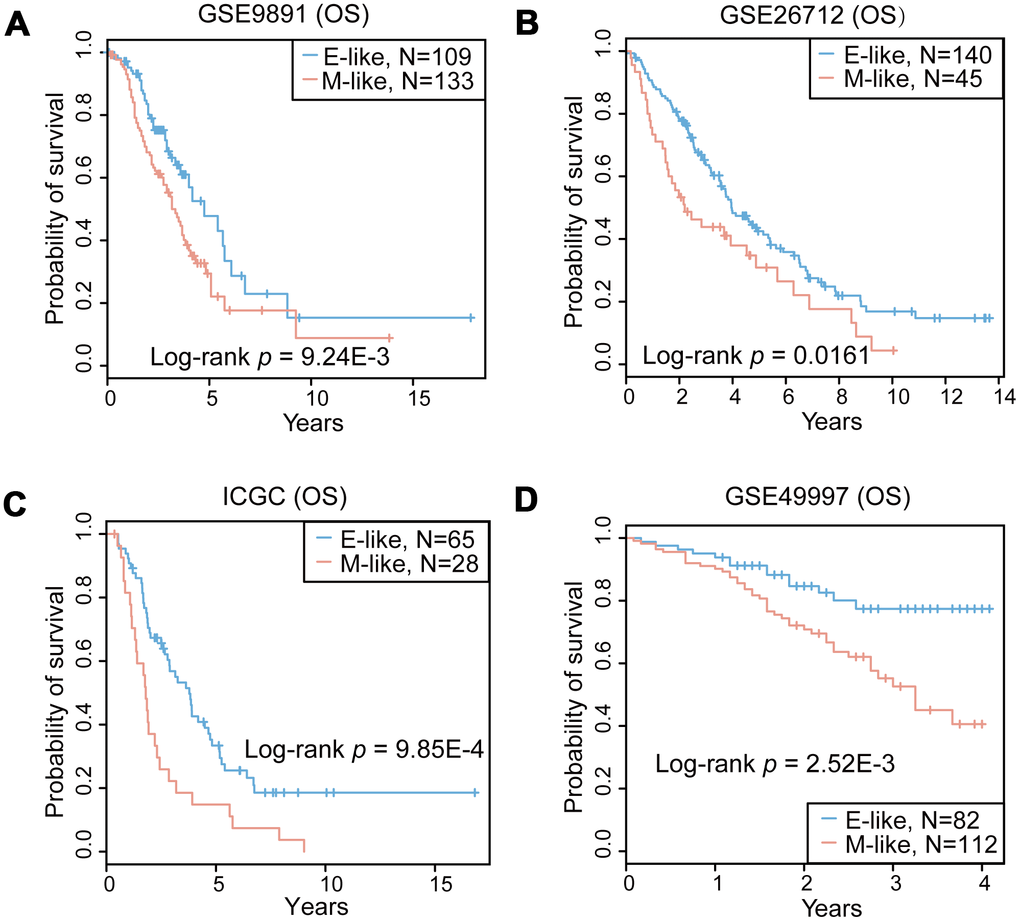
Figure 4.Prognostic performance of the 16-GPS in the OvCa cohorts. (A–D) Kaplan-Meier overall survival (OS) curves for the OvCa epithelial-like (E-like, blue) and mesenchymal-like (M-like, orange) phenotypes in GSE9891 (A), GSE26712 (B), ICGC (C), and GSE49997 (D) datasets.