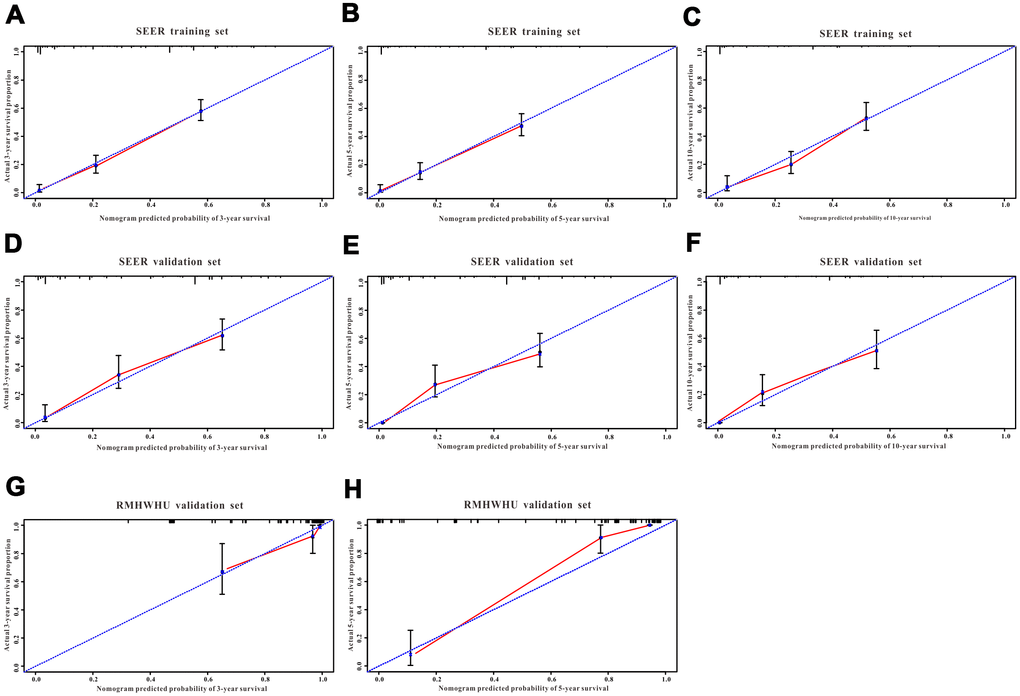
Figure 6.The calibration curves for predicting all-cause mortality in the training and validation cohorts. Calibration plots of 3-year, 5-year and 10-year mortality in (A–C) the training cohort, (D–F) the SEER validation cohort, and (G–H) the RMHWHU validation cohort.