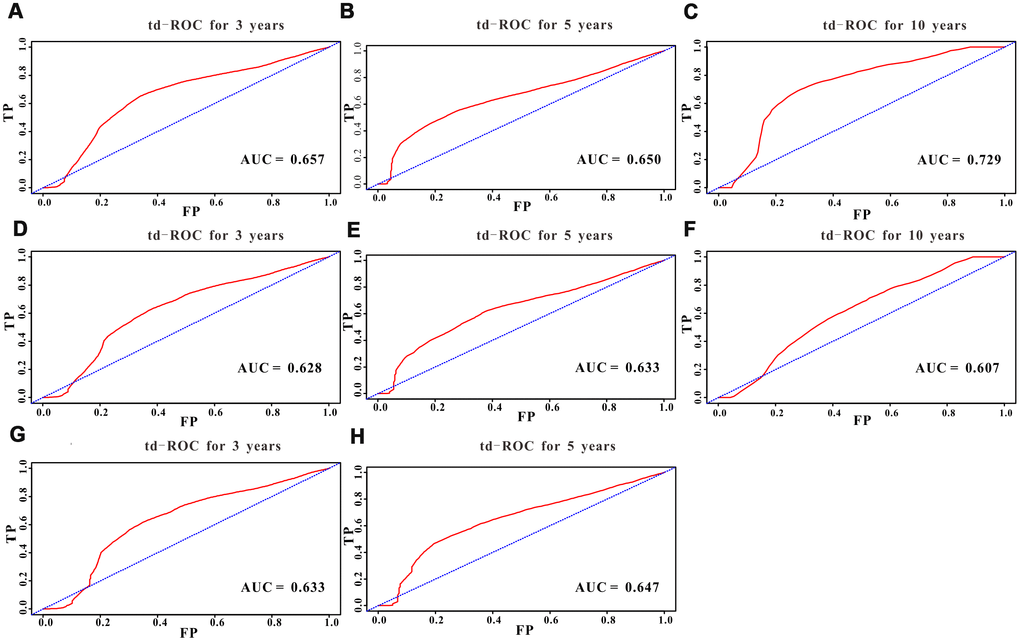
Figure 5.Predictive performance of the survival nomogram reflected by td-ROC curves. td-ROC curves for the 3-year, 5-year and 10-year all-cause mortality nomogram of EODGC patients in (A–C) the training cohort, (D–F) the SEER validation cohort, and (G–H) the RMHWHU cohort.