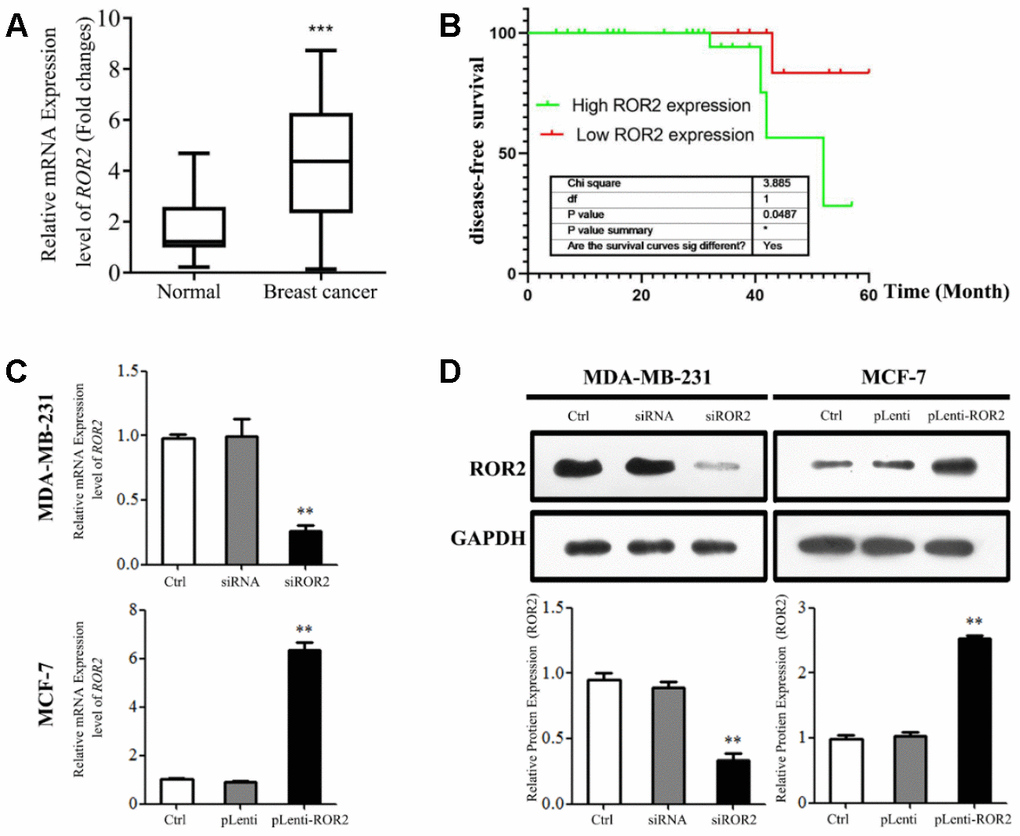
Figure 1.High ROR2 expression correlates with poor clinical outcome in BC patients. (A) ROR2 mRNA levels in 45 pairs of BC tissues compared with corresponding adjacent normal tissues. (B) Kaplan-Meier DFS curves for 45 BC patients classified according to ROR2 mRNA levels. (C, D) ROR2 expression analyzed by qRT-PCR (C) and Western blotting (D) in MDA-MB-231 and MCF-7 cells transfected with siROR2 and pLenti-ROR2 plasmids. Image J software (version 1.48, NIH, USA) was used for the quantitative analysis of ROR2 protein levels analyzed by western blotting. Results are shown as means ± SD, n=3; *p<0.05, **p<0.01, ***p<0.001.