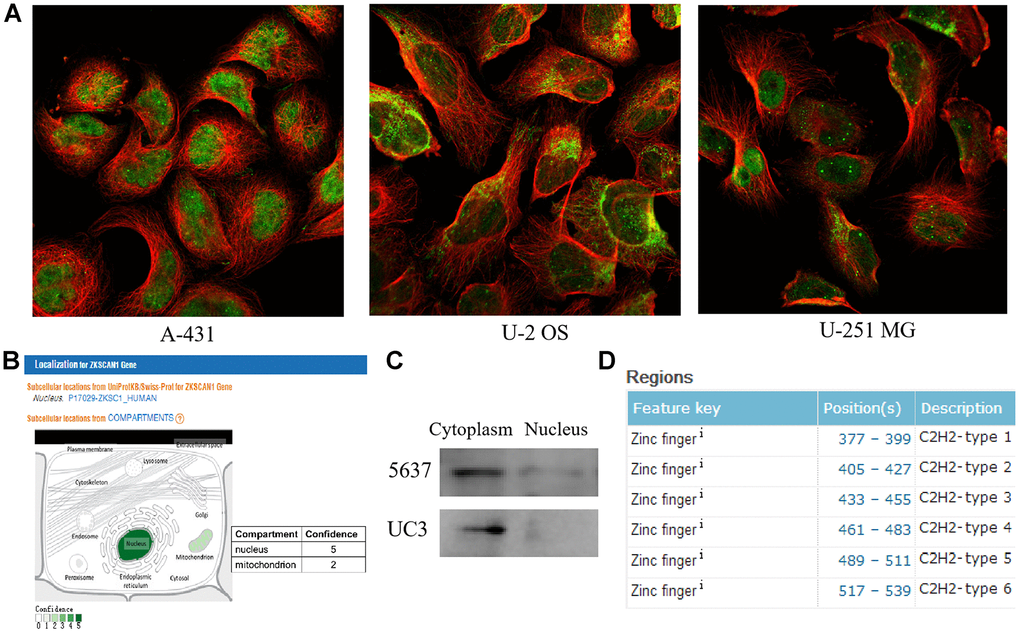
Figure 2.The subcellular localization and structural analyses of ZNF139. (A) The subcellular localization for ZNF139 obtained from Human Protein Atlas database (https://www.proteinatlas.org/), green represents antibody and red represents microtubules. (B) The subcellular localization for ZNF139 obtained from GeneCards database (https://www.genecards.org/). (C) The subcellular localization for ZNF139 in BC cells as analyzed by western blot assays. (D) The structural analysis of ZNF139 based on UniProt database (https://www.uniprot.org/). BC, bladder cancer.
Figure 2 — ZNF139/circZNF139 promotes cell proliferation, migration and invasion via activation of PI3K/AKT pathway in bladder cancer | Aging