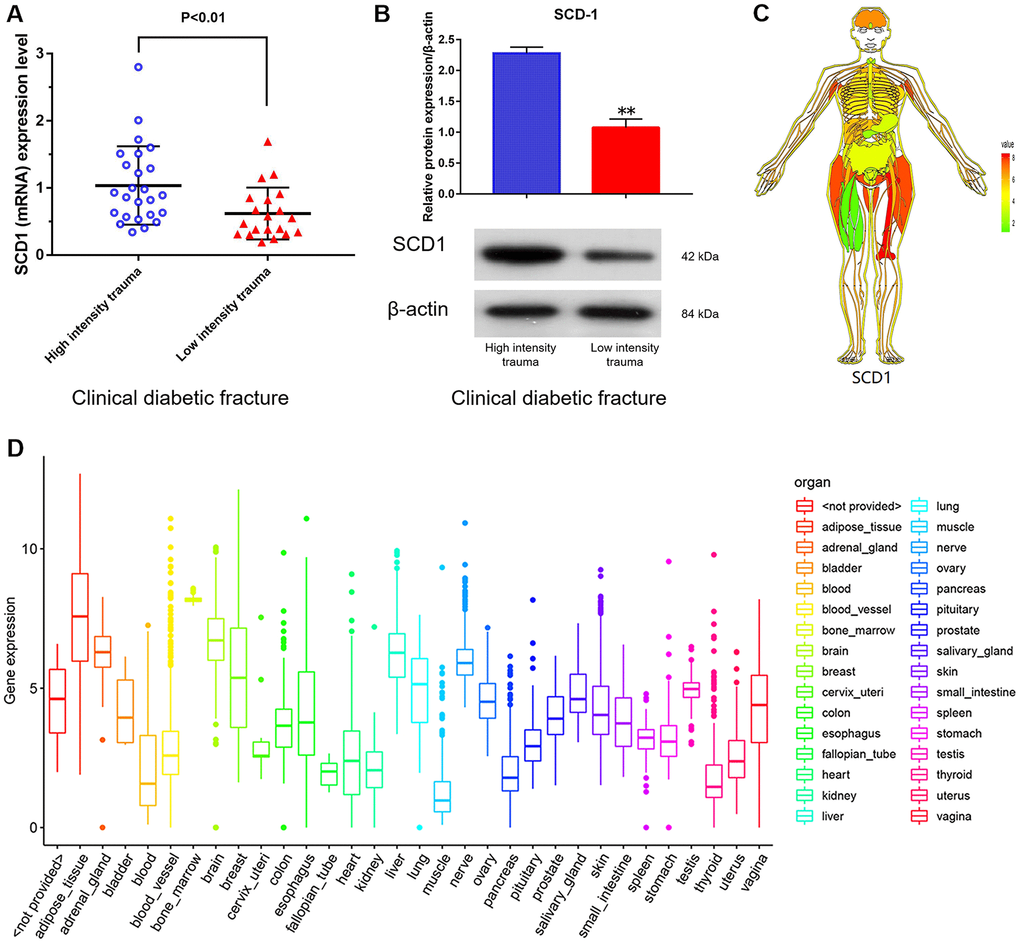
Figure 1.SCD1 expression in humans. (A) (mRNA) (B) (protein) showed the difference in SCD1 expression between patients with diabetic high-intensity fractures and patients with low-intensity fractures. (C, D) showed the human tissue enriched protein expression maps and the boxplot of SCD1 expression with high levels of SCD1 expression (GTEX cohort, n = 68).