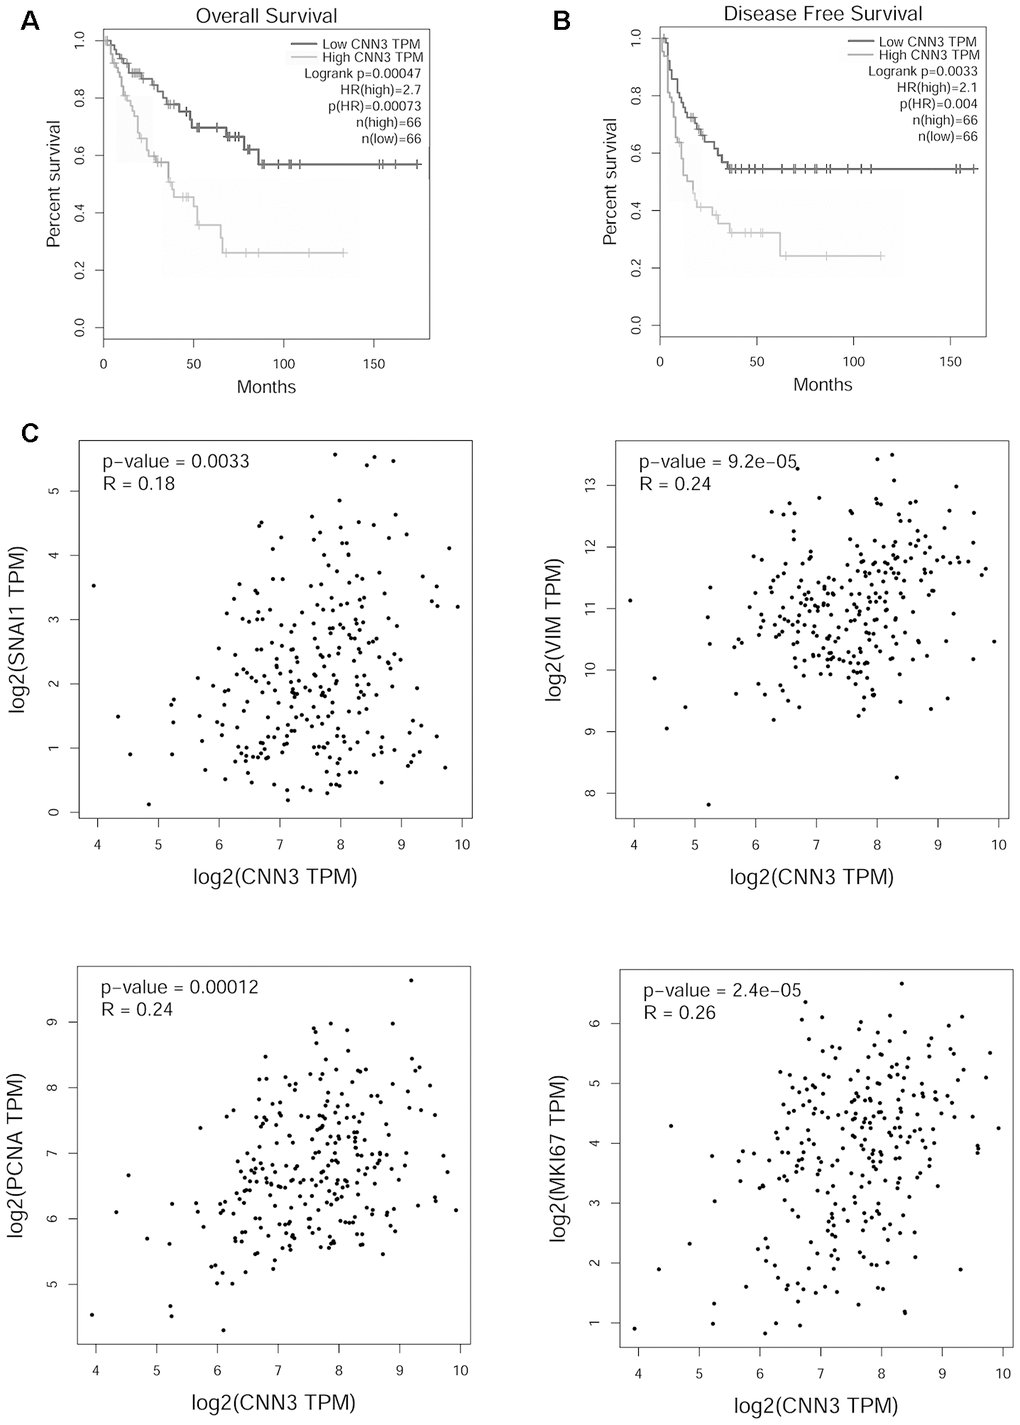
Figure 2.Functional analysis of CNN3 in TCGA sarcoma cohort analyzed using GEPIA. (A, B) Correlation between CNN3 mRNA levels and prognosis. (C) Correlation between CNN3 mRNA levels and two mesenchymal markers, Snail and vimentin (VIM), and two tumor proliferation markers, MKI67 and PCNA. TPM: transcripts per million; HR: hazard ratio. The hazard ratio was calculated based on the Cox PH model.