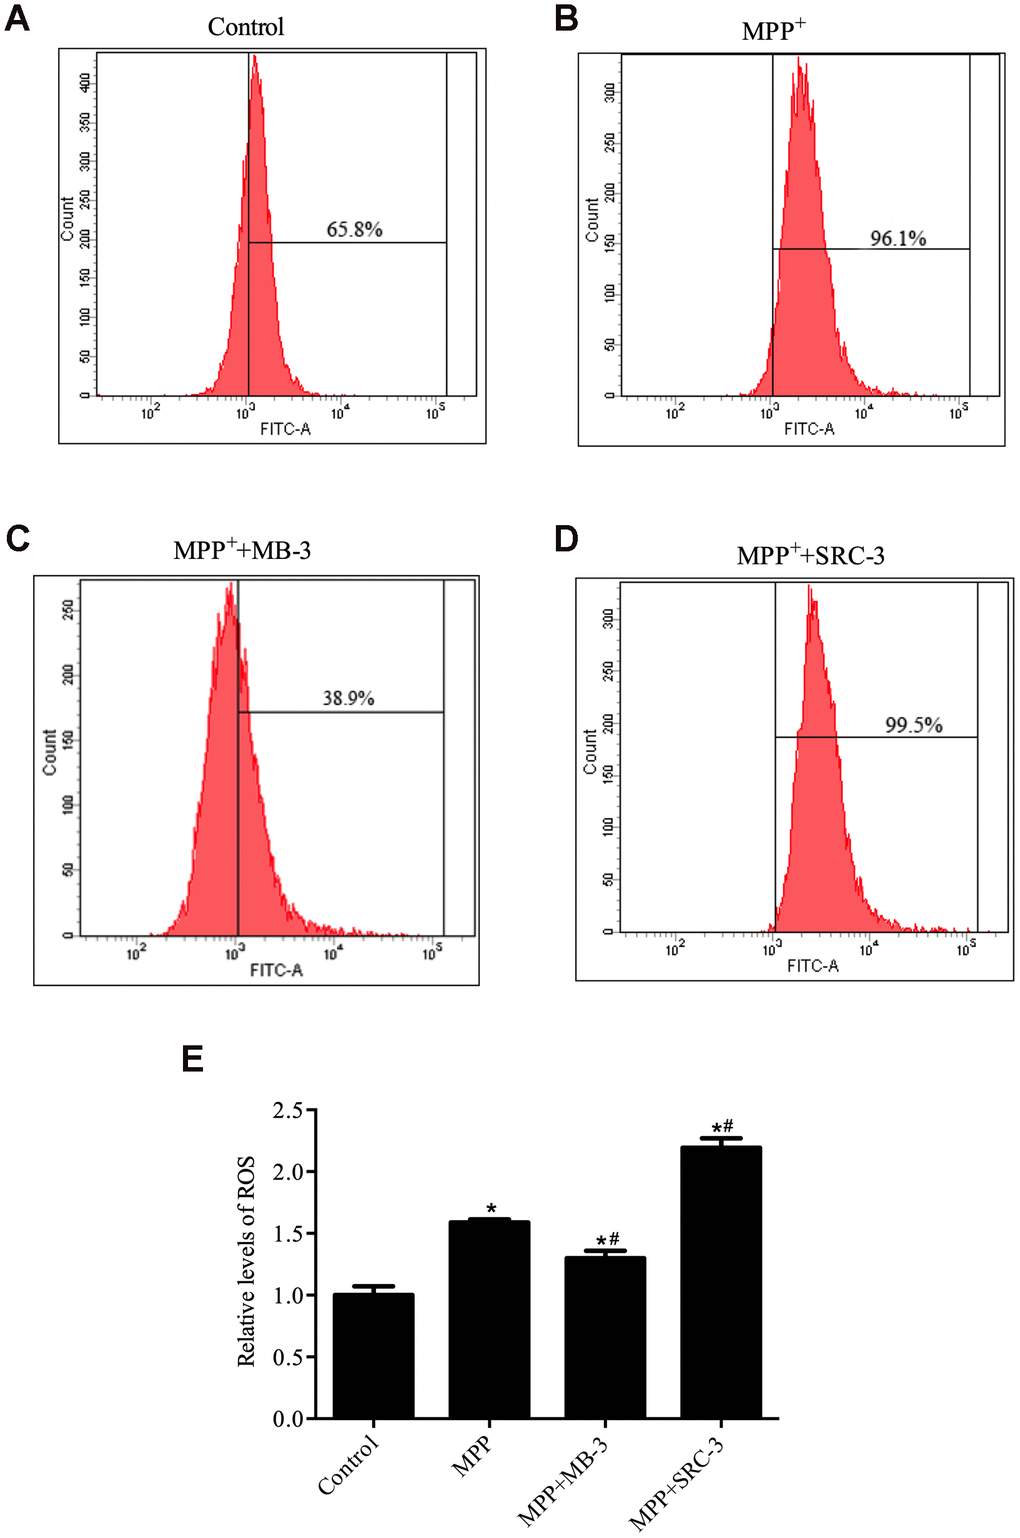
Figure 3.ROS production was regulated by GCN5 in MPP+-treated cell model. (A) Relative levels of ROS in control group; (B) Relative levels of ROS in cells treated with MPP+ (1000 μM), (C) Relative levels of ROS in cells treated with MPP+ (1000 μM) and MB-3 (50 μM); (D) Relative levels of ROS in cells treated with MPP+ (1000 μM) and SRC-3 (100 ng/mL). (E) Bar graph of relative levels of ROS; n=6, per group. *P < 0.05 vs. control group; # P < 0.05 vs. MPP+ group.