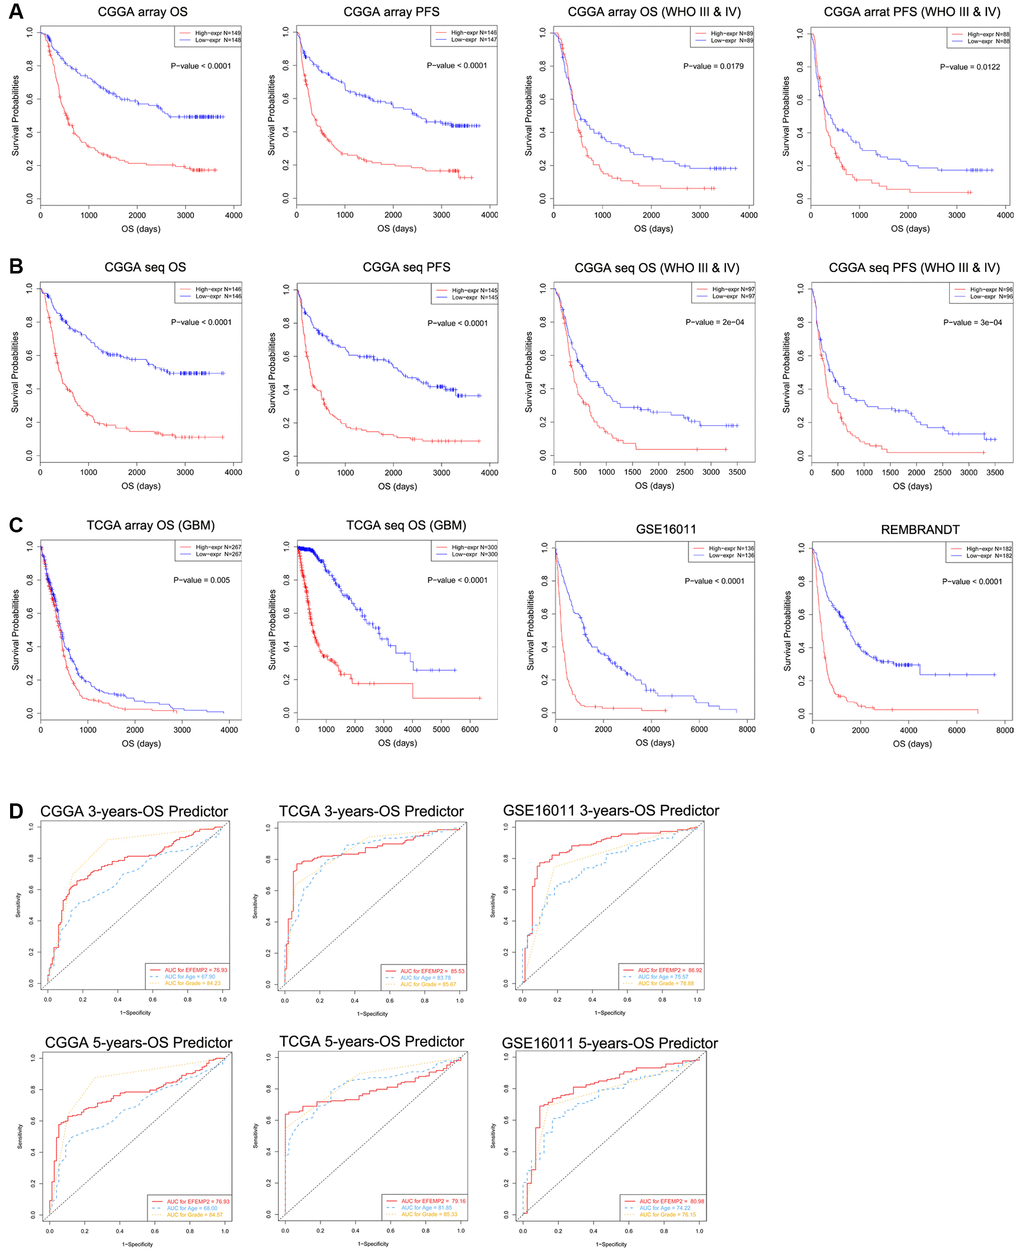
Figure 3.Patients with higher EFEMP2 transcription level exhibits poorer OS and PFS. (A) The half of patients with higher EFEMP2 expression exhibited shorter OS and PFS in Kaplan-Meier analyses based on CGGA mRNA array dataset. (B) The half of patients with higher EFEMP2 expression exhibited shorter OS and PFS in Kaplan-Meier analyses based on CGGA mRNA sequencing dataset. (C) Kaplan-Meier analyses of OS based on TCGA mRNA array, TCGA mRNA sequencing data, GSE16011 and REMBRANDT datasets. (D) The ROC curves indicating the sensitivity and specifcity of predicting 3- or 5-years of overall survival with EFEMP2-level in CGGA, TCGA, or GSE16011 database.