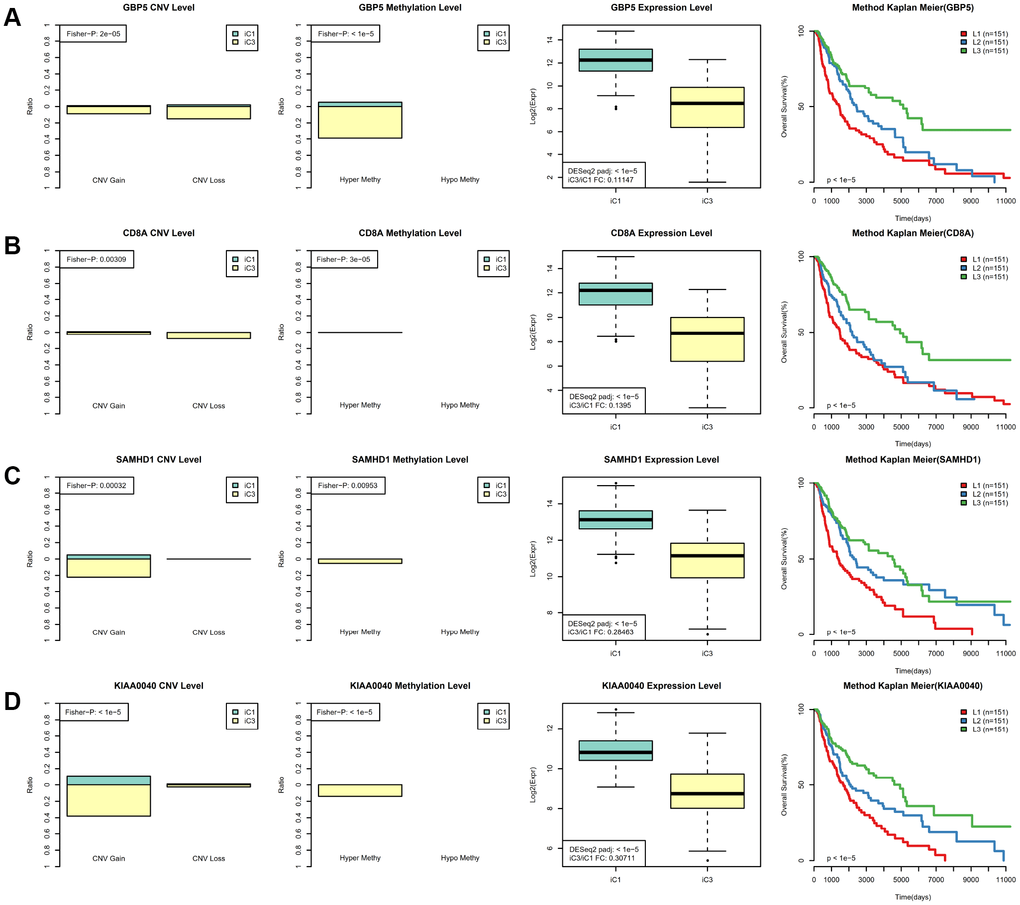
Figure 8.Identification of key molecular features in SKCM subtypes. (A) GBP5 MET, CNV, and expression levels in the iC1 and iC3 subtypes are shown in the left panel. Samples were divided among high (L3), medium (L2), and low (L1) groups based on GBP5 gene expression; Kaplan–Meier plot analysis for these groups is shown in the right panel. (B) CD8A MET, CNV, and expression levels in the iC1 and iC3 subtypes are shown in the left panel; Kaplan–Meier plot analysis for L1, L2, and L3 CD8A groups is shown in the right panel. (C) SAMHD1 MET, CNV, and expression levels in the iC3 and iC4 subtypes are shown in the left panel; Kaplan–Meier plot analysis for L1, L2, and L3 SAMHD1 groups is shown in the right panel. (D) KIAA0040 MET, CNV, and expression levels in the iC3 and iC4 subtypes are shown in the left panel; Kaplan–Meier plot analysis for L1, L2, and L3 KIAA0040 groups is shown in the right panel.