Submit an Article
Navigate
Home
Editorial Board
Editorial Policies
Current Volume
Archive
Scientific Integrity
Publication Ethics Statements
Interviews with Outstanding Authors
Newsroom
Sponsored Conferences
Podcast
Contact
Special Collections
Submit an Article
Online ISSN: 1945-4589
Research Paper
|
Volume 12, Issue 7
|
pp. 5977–5991
Nrf2 deficiency promotes the increasing trend of autophagy during aging in skeletal muscle: a potential mechanism for the development of sarcopenia
Back to article
Figure 4
(4 of 11)
−
100%
+
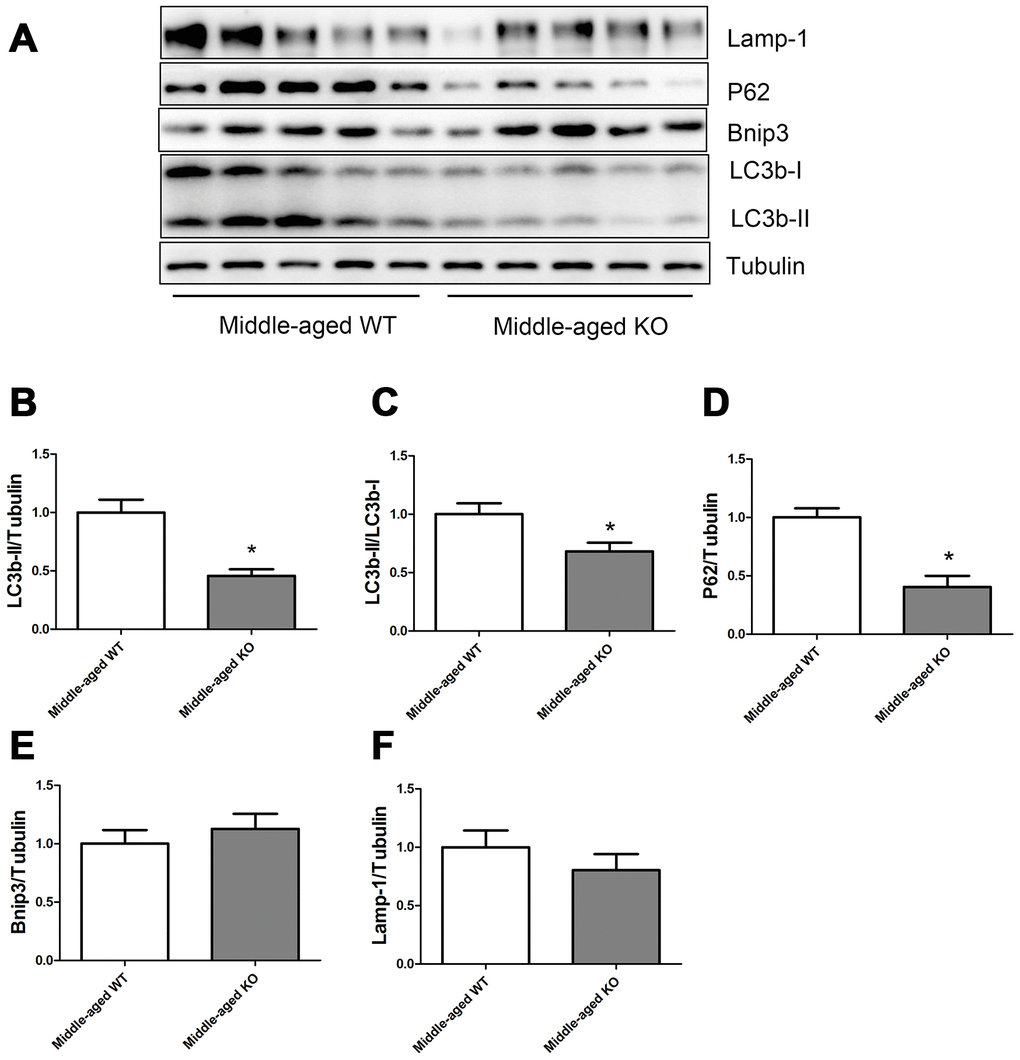
Figure 4.
Expression of LC3b-II, LC3b-I, P62, Bnip3, and Lamp-1 proteins in middle-aged WT and middle-aged KO mice.
(
A
) Western blot images. (
B
–
F
) Statistical graphs. Data represent mean ± SE, (n=5), *statistically significant.