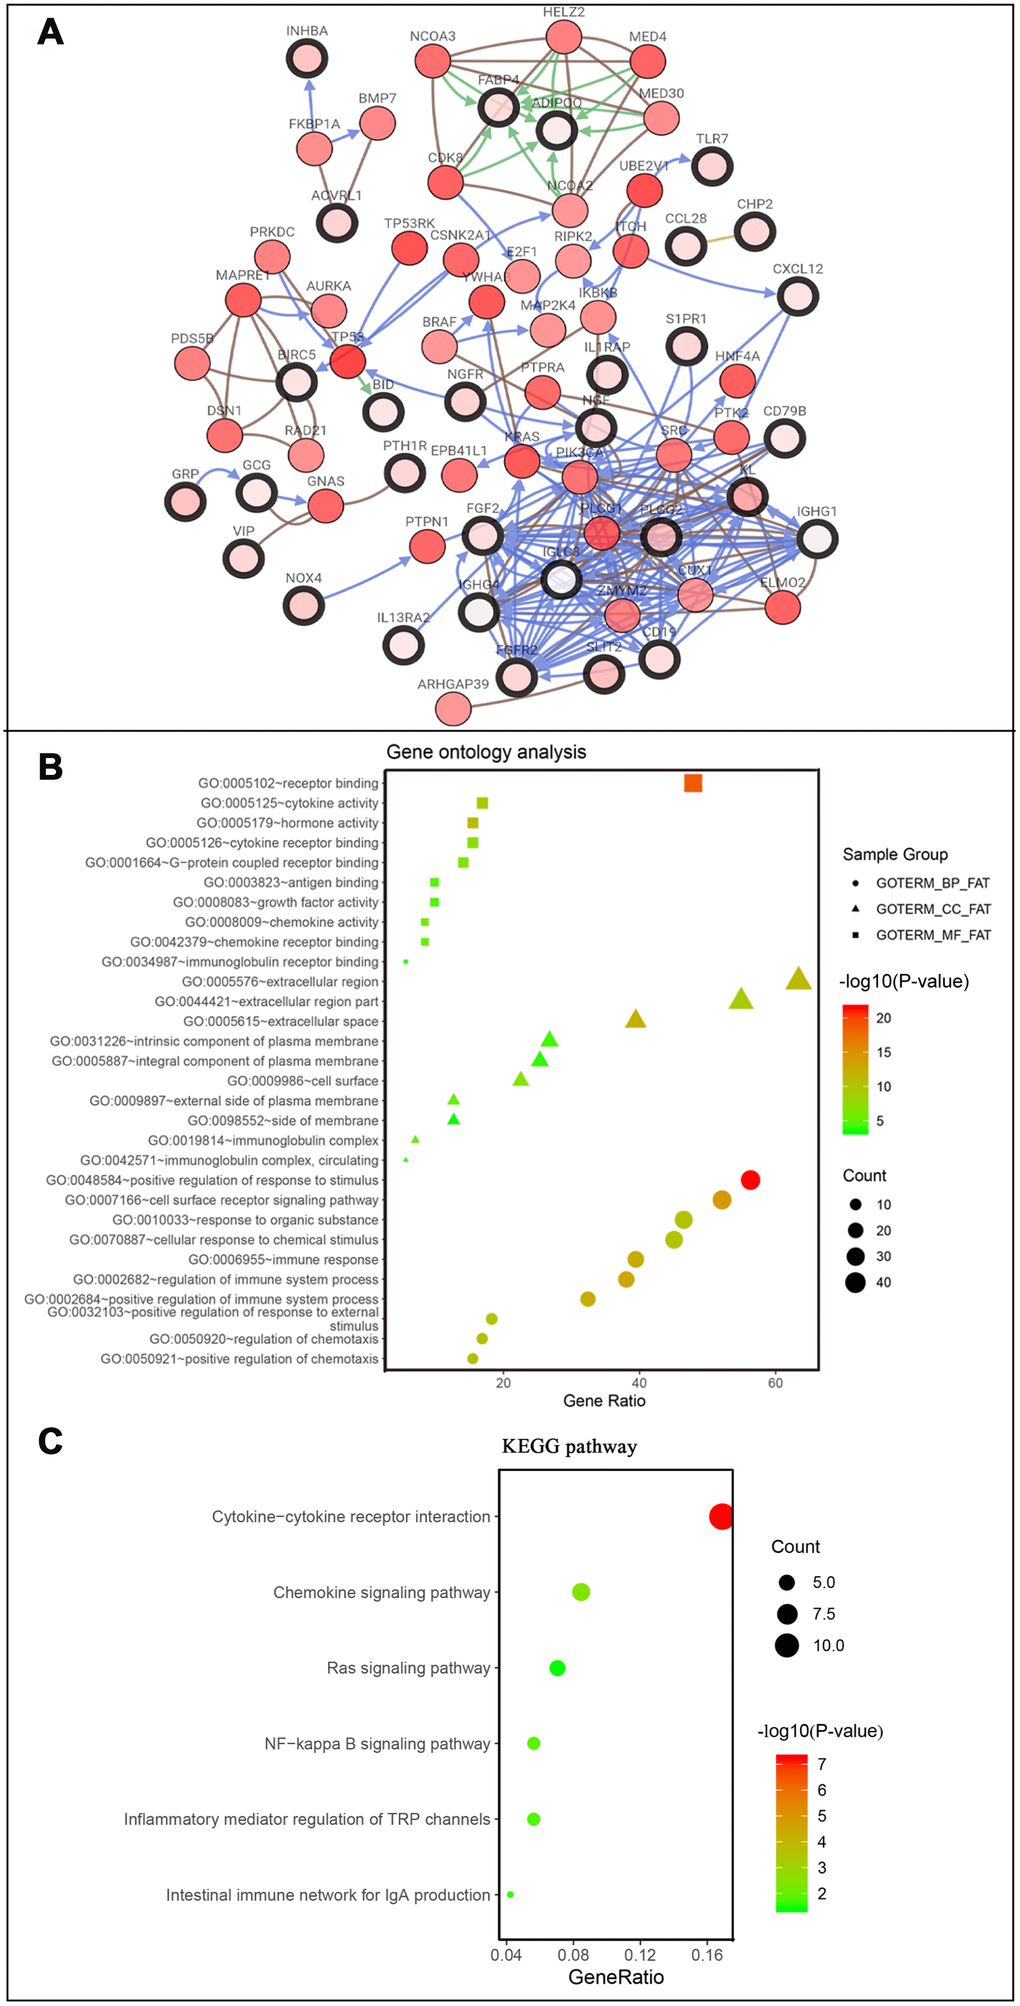
Figure 5.Co-expression network and gene enrichment analysis of prognostically relevant IRGs. (A) Network of prognostic IRGs and their co-expressed genes, with black-boxed nodes indicating prognostic IRGs and the remaining nodes indicating genes co-expressed with prognostic IRGs. (B) Gene ontology analysis and (C) KEGG pathway analysis of prognostic IRGs.