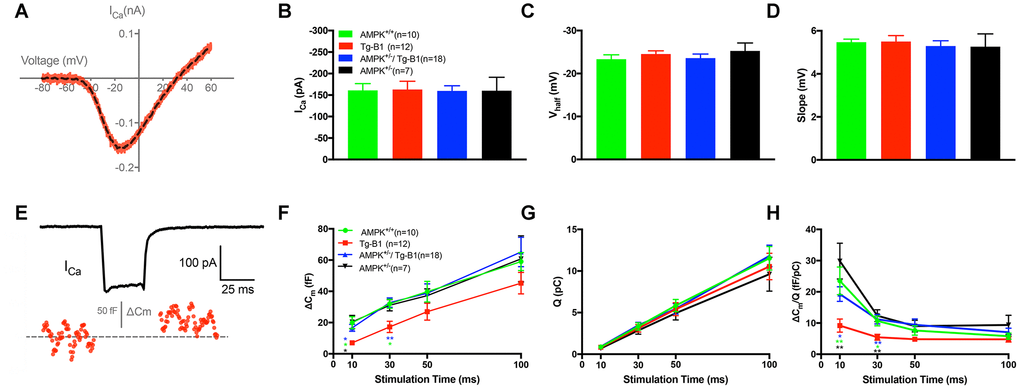
Figure 4.IHC patch clamp recordings reveal normal calcium current but reduced vesicle release in Tg-B1 mice. (A) Representative trace for voltage-dependent calcium current (ICa) of WT controls mice (red curve) showed I-V relationship of calcium current in IHCs after leakage subtraction and fitted with a double exponential function (dotted line in black). (B–D) The Ca2+ current amplitude (ICa, Panel B), the voltage of half-maximal activation (Vhalf, Panel C) and the slope of the calcium activation curve (Panel D) were obtained from the current-voltage relationship fitted with Boltzmann function. No significant differences of ICa (F(3,43)=0.0074, p=0.9991), Vhalf (F(3,43)=0.5325, p=0.6624) and Slope of ICa (F(3,43)=0.2187, p=0.8829, one-way ANOVA followed by Bonferroni post-test) were found in IHCs of each group. (E) Representative trace of whole-cell membrane capacitance (Cm) shows measurements of exocytosis of IHC. The depolarization step stimulus induced ICa and triggered exocytosis (ΔCm) in WT. (F-H) Stimulus durations from 10 to 100 ms were applied to examine the release of synaptic vesicles. (F): The ΔCm significantly reduced in the Tg-B1 group compared to WT controls for shorter stimuli of 10 ms (p=0.0148) and 30 ms (p=0.0289). AMPK+/−/Tg-B1 mice (blue) exhibited significantly larger membrane capacitance change (ΔCm) than Tg-B1 mice (red) at stimulus durations of 10 ms (p=0.0463) and 30 ms (p=0.0052, one-way ANOVA followed by Bonferroni post-test). Although presented as a trend, stimulus time longer than 50 ms show no significant difference in ΔCm of all groups. (G): Ca2+ current charge (QCa) has no significant difference (F(3,43)=0.3077, p=0.8197, two-way ANOVA followed by Bonferroni post-test) for each group for each stimulus duration. (H): The ratio of ΔCm/Q, which reflects Ca2+ efficiency in triggering exocytosis, was significantly lower in IHCs from Tg-B1 mice (red) compared to WT controls (green) for stimulation of 10 ms (p=0.005, one-way ANOVA followed by Fisher’s LSD post-test) and 30 ms (p=0.024, one-way ANOVA followed by Fisher’s LSD post-test), while there was a significant elevation of ΔCm/Q for short stimulation of 10 ms (p=0.020, one-way ANOVA followed by Fisher’s LSD post-test) and 30 ms (p=0.005, one-way ANOVA followed by Fisher’s LSD post-test) in AMPK+/−/Tg-B1 mice (blue) compared to Tg-B1 group, similar to WT controls and AMPK+/− group (black). All data are presented as means ± SEM; * P<0.05, ** P<0.01; n=10, 12, 18 and 7 for WT, Tg-B1, AMPK+/−/Tg-B1 and AMPK+/− group, respectively.