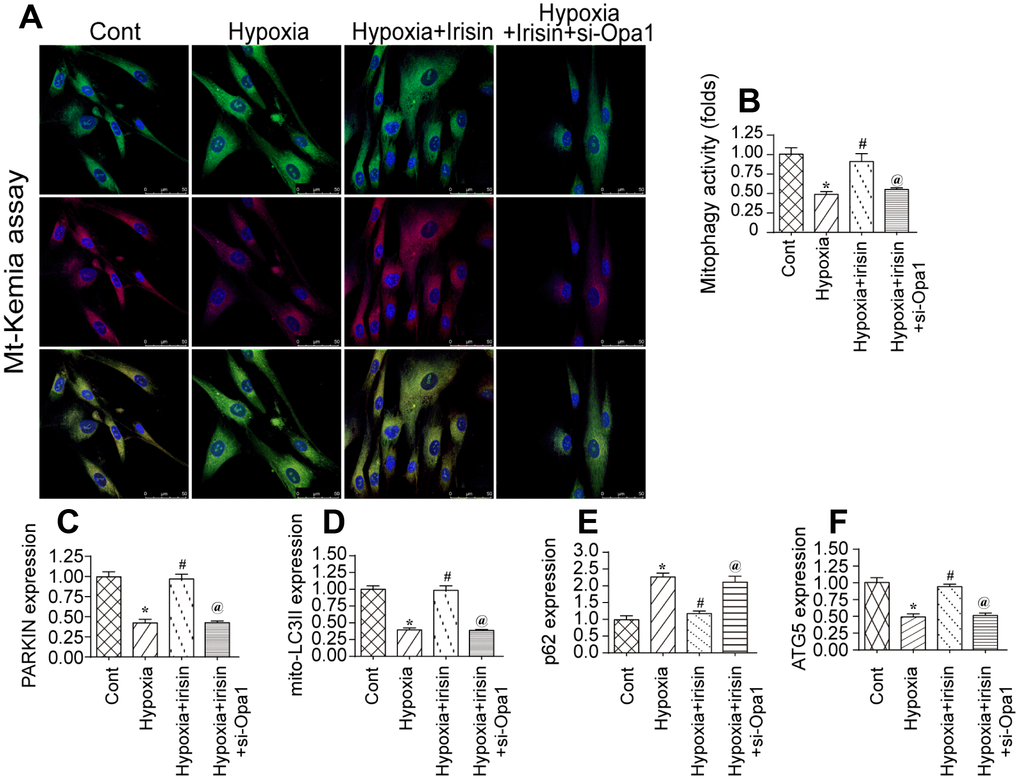
Figure 2.Irisin activates Opa1-induced mitophagy. (A, B) Flow cytometry analysis of mitophagy using the fluorescent probe mt-Keima. (C–F) Analysis of the expression of mitophagy-associated proteins by western blotting. *P < 0.05 vs. the control group; #P < 0.05 vs. the hypoxia + irisin group.