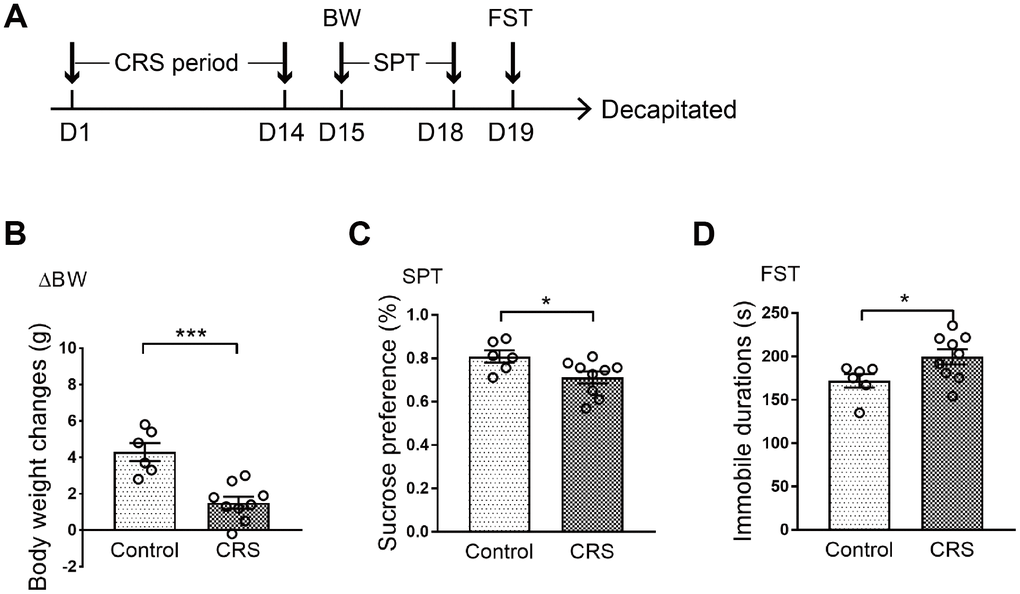
Figure 1.Depressive-like behaviors in CRS mice. (A) Schematic of the experimental process. The CRS process lasted 14 days. (B) The body weight changes of the two groups were displayed. (C) Sucrose preference was tested. (D) Immobile durations in FST after CRS. (* p<0.05, *** p<0.001; n=6-9 mice per group).