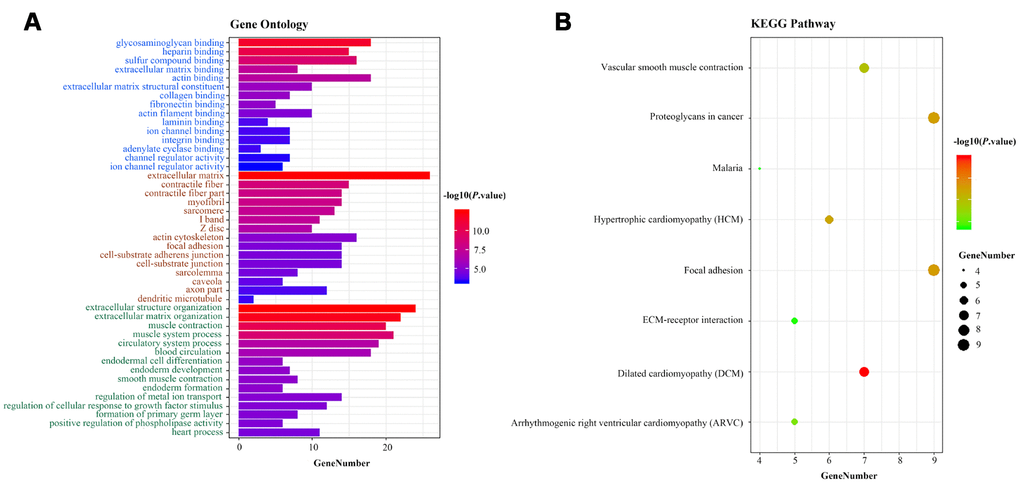
Figure 8.Functional enrichment analysis of the three-lncRNA signature. (A) GO enrichment analysis. Blue, brown and green words represent the GO terms for molecular functions, cellular components and biological processes, respectively. (B) KEGG enrichment analysis. The x-axis represents the number of genes, while the y-axis displays the GO terms and KEGG pathways. The color represents the P value.