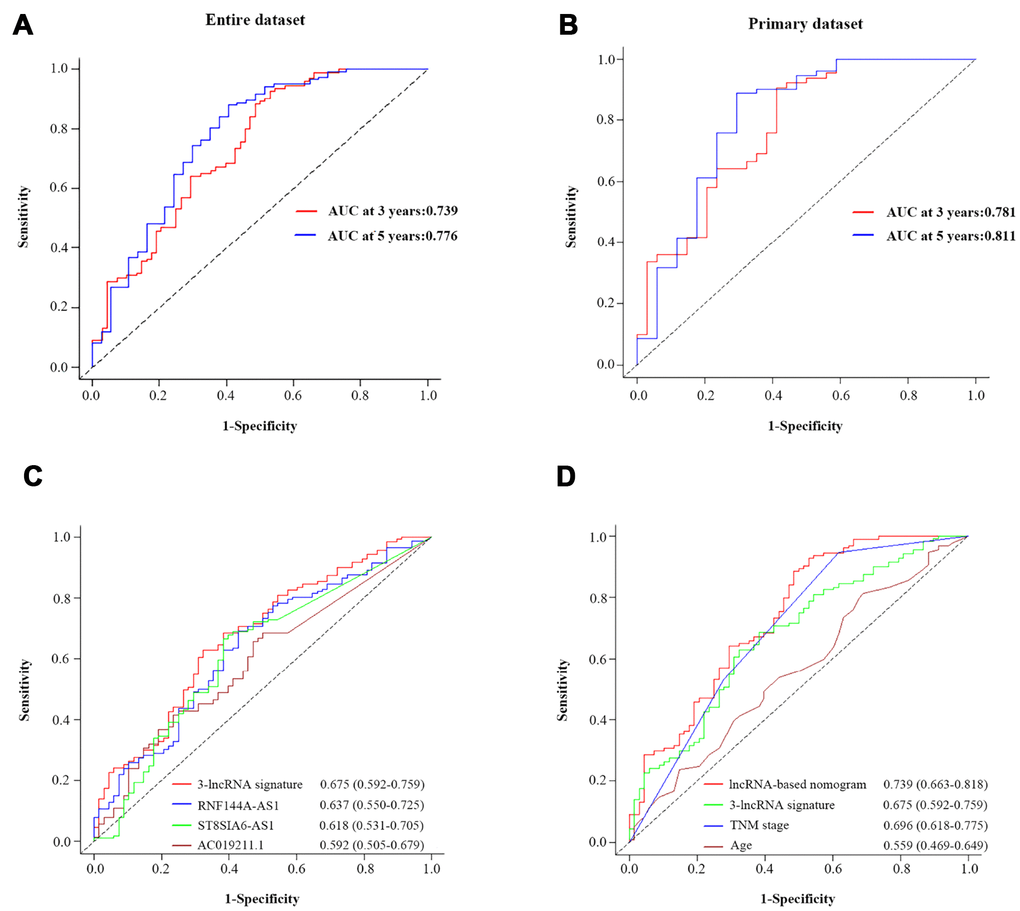
Figure 7.The prognostic value of the composite nomogram in comparison with other prognostic factors. Time-dependent ROC curves of the nomogram for predicting OS in the entire dataset (A) and the primary dataset (B). (C) The prognostic accuracy of the three-lncRNA signature compared with those of single lncRNAs. (D) The prognostic accuracy of the three-lncRNA-based prognostic nomogram compared with those of the three-lncRNA signature, TNM stage and age.