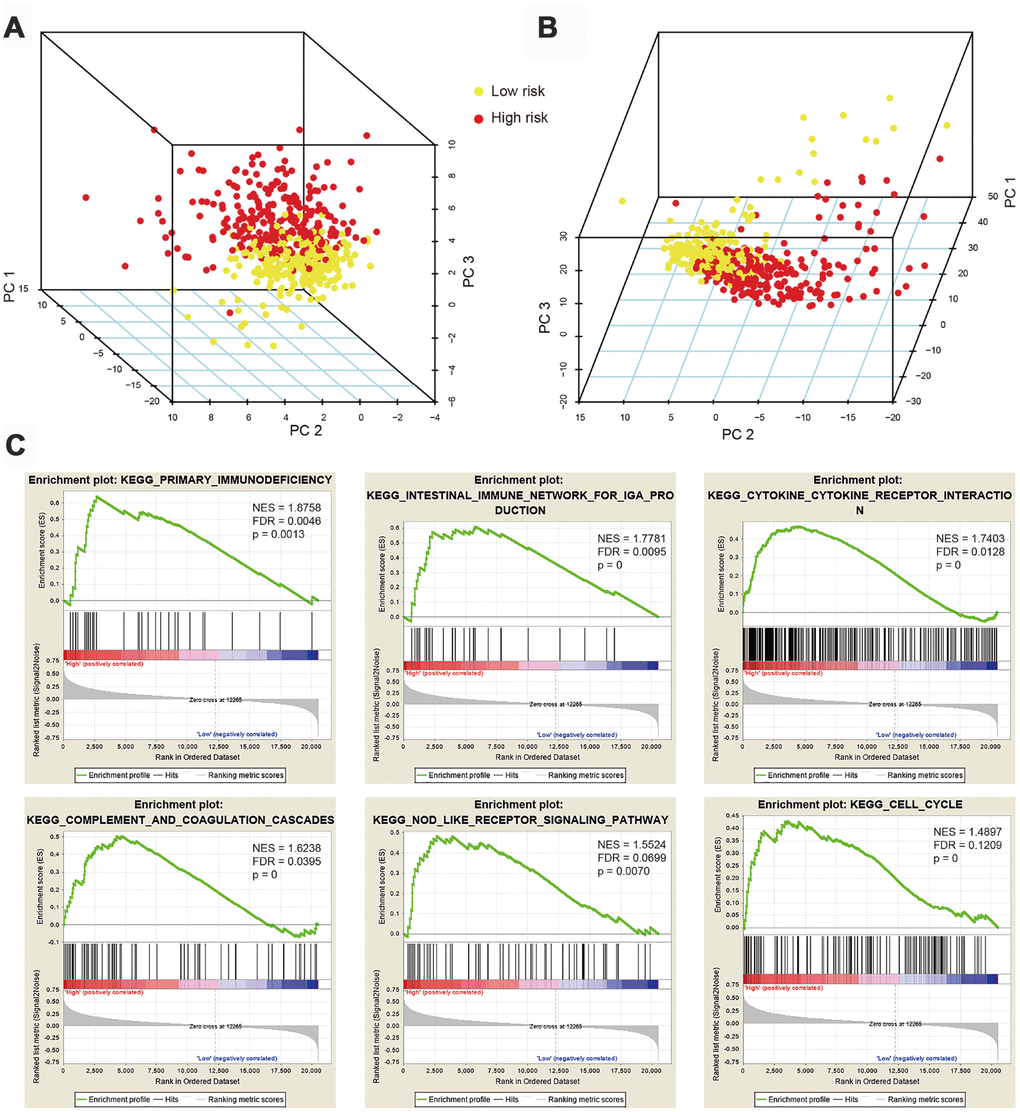
Figure 4.Principal component analysis (PCA) and gene set enrichment analysis (GSEA). (A) PCA based on 47 immune-related hub genes (IRGs) showing distinct immune phenotypes in high- and low-risk patient groups. (B) Distribution patterns for the two risk groups based on 326 differentially expressed IRGs. (C) GSEA results showing significant enrichment of immune-related phenotype in high-risk patients.