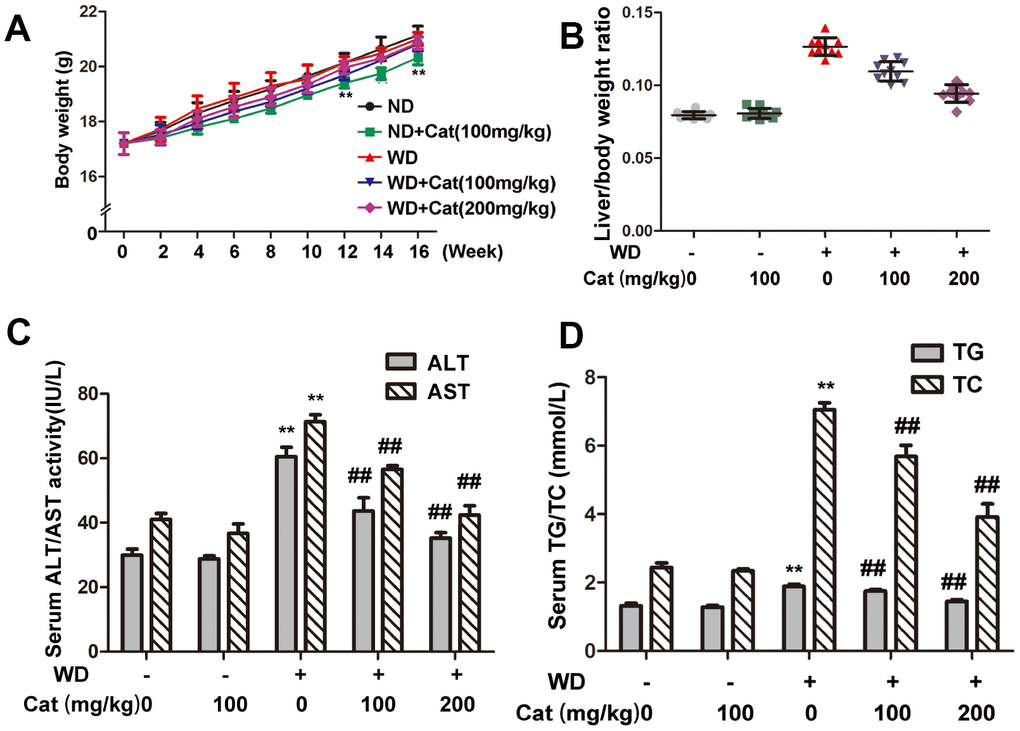
Figure 2.Catalpol ameliorated liver index, hepatic injury in LDLr-/- mice. (A) Body weights variation during 16 weeks period. (B) Liver index. (C) Serum levels of ALT and AST. (D) Serum levels of TC, TG. The results are the mean ± SD (n=10), **P< 0.05 vs. Control group, ##P < 0.05 vs. WD group. ND: normal diet; WD: western diet.