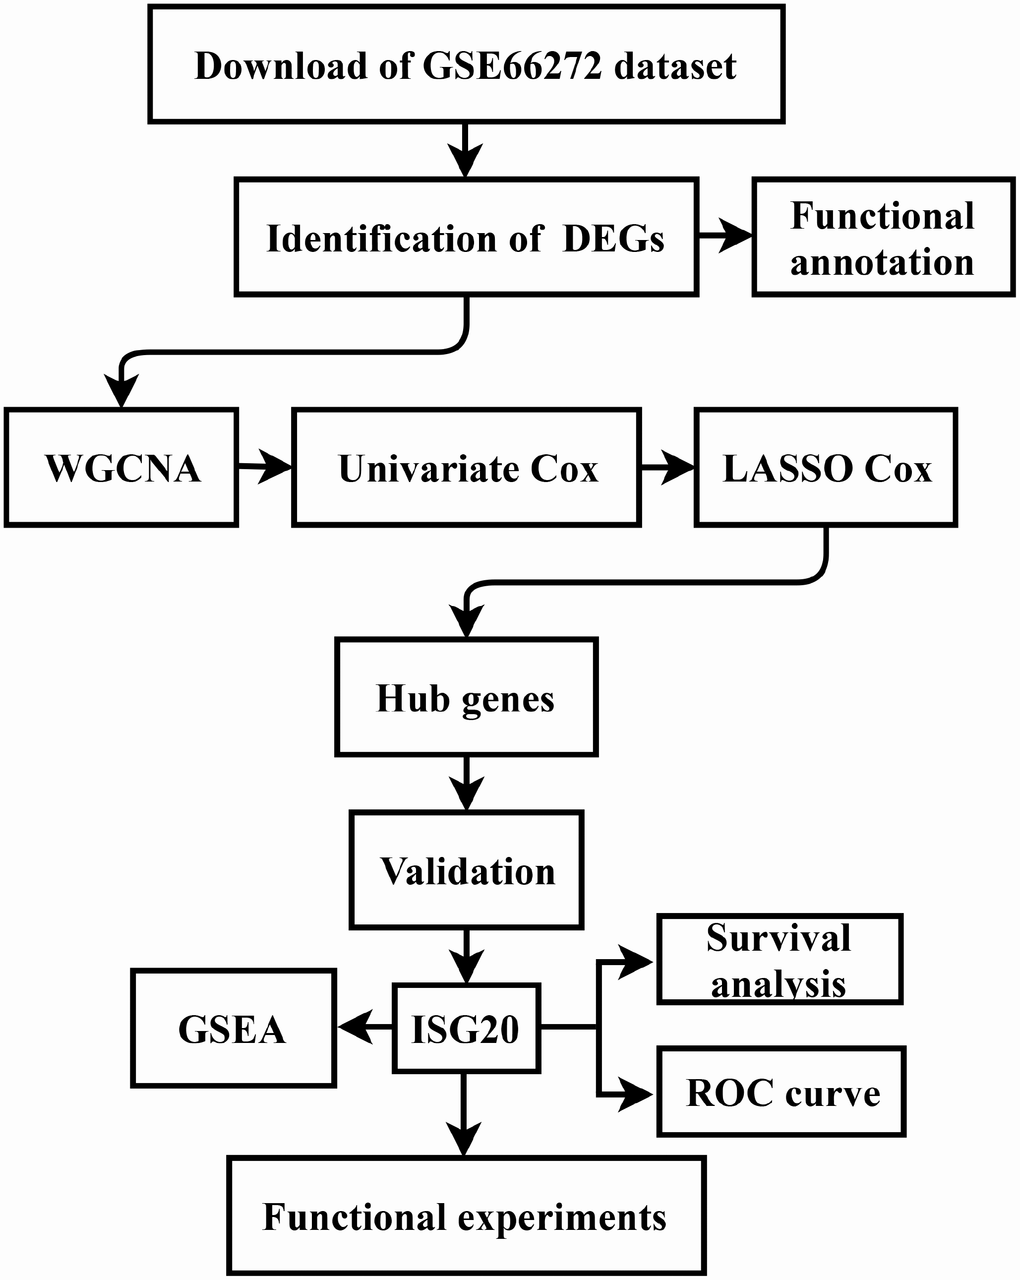
Figure 9.Flow diagram of the study. Data collection and analysis were exhibited in the flow diagram. DEGs: differentially expressed genes; WGCNA: weighted gene co-expression network analysis; LASSO: least absolute shrinkage and selection operator; GSEA: gene set enrichment analysis; ROC: receiver operator characteristic.