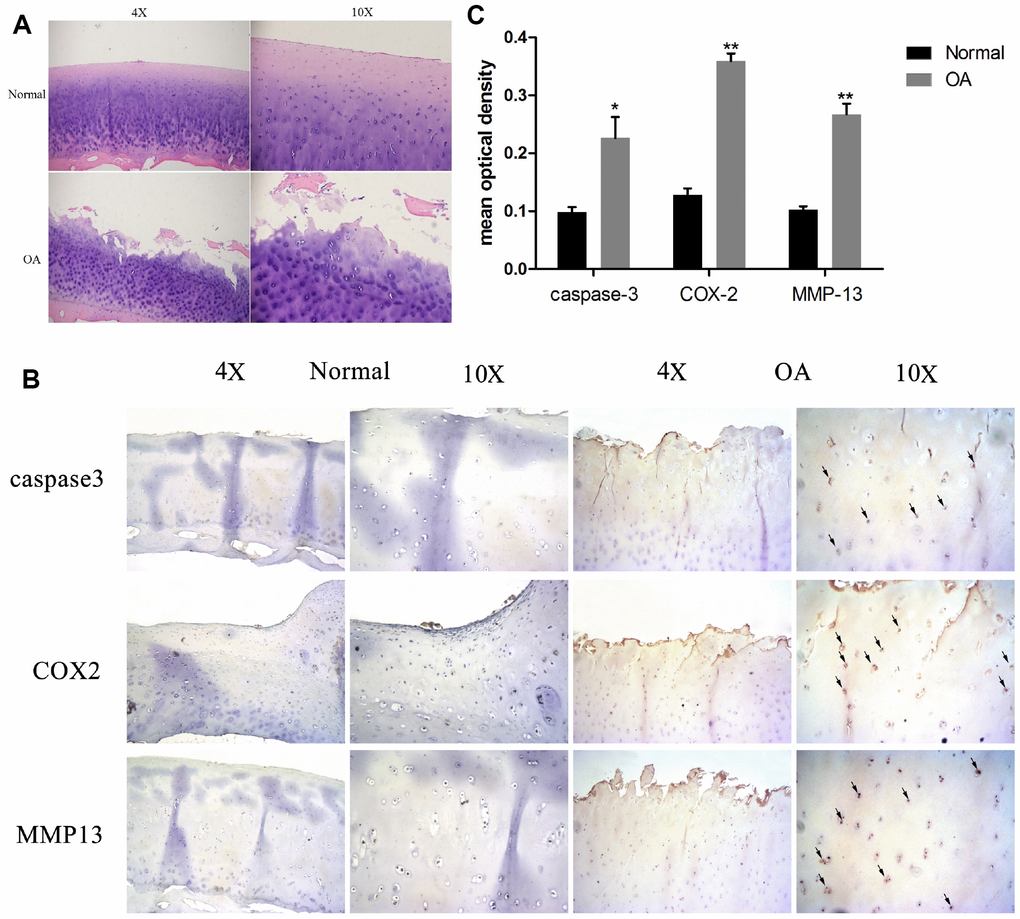
Figure 1.Chondrocyte apoptosis, inflammation, and matrix degradation in the OA samples. (A) Representative images of H&E staining; (B) Representative images of immunohistochemistry; (C60) Quantitative optical density analysis of immunohistochemistry. Data represent the mean ± SD (n=5) and were analyzed by one-way analysis of variance followed by Tukey's post hoc test. ** p < 0.01 and * p < 0.05 versus normal samples.