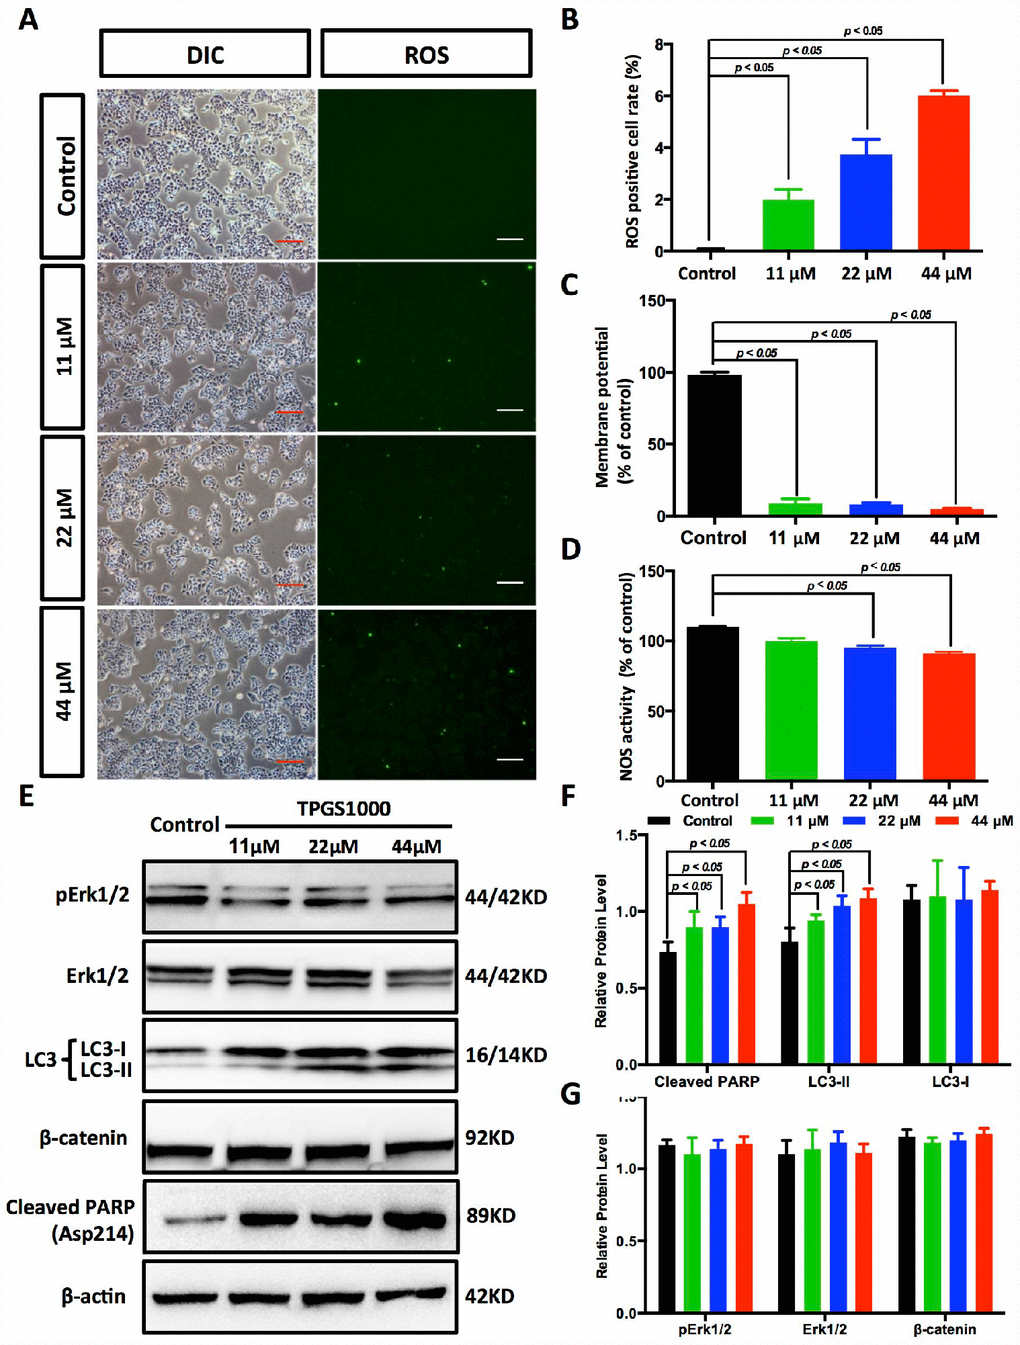
Figure 5.TPGS dose dependently induced the production of ROS and reduced energy production in HCC cells. (A) ROS imaging (green fluorescence) in TPGS-treated HCC cells, scale bar = 100 μm. (B) Quantitative analysis of ROS production in TPGS-treated HCC cells. The 44 μM TPGS group had the highest ROS positive cell rate, 6.0%. (C) ΔΨ levels were analysed in HCC cells to evaluate energy production. (D) Effects of TPGS treatments on NOS activity. (E) TPGS induced an increase of cleaved PARP protein levels and LC3-II protein accumulation in TPGS-treated HCC cells. (F and G) Quantitative analysis of western blot results from (E). All protein levels were normalized with the housekeeping genes GAPDH and β-actin.