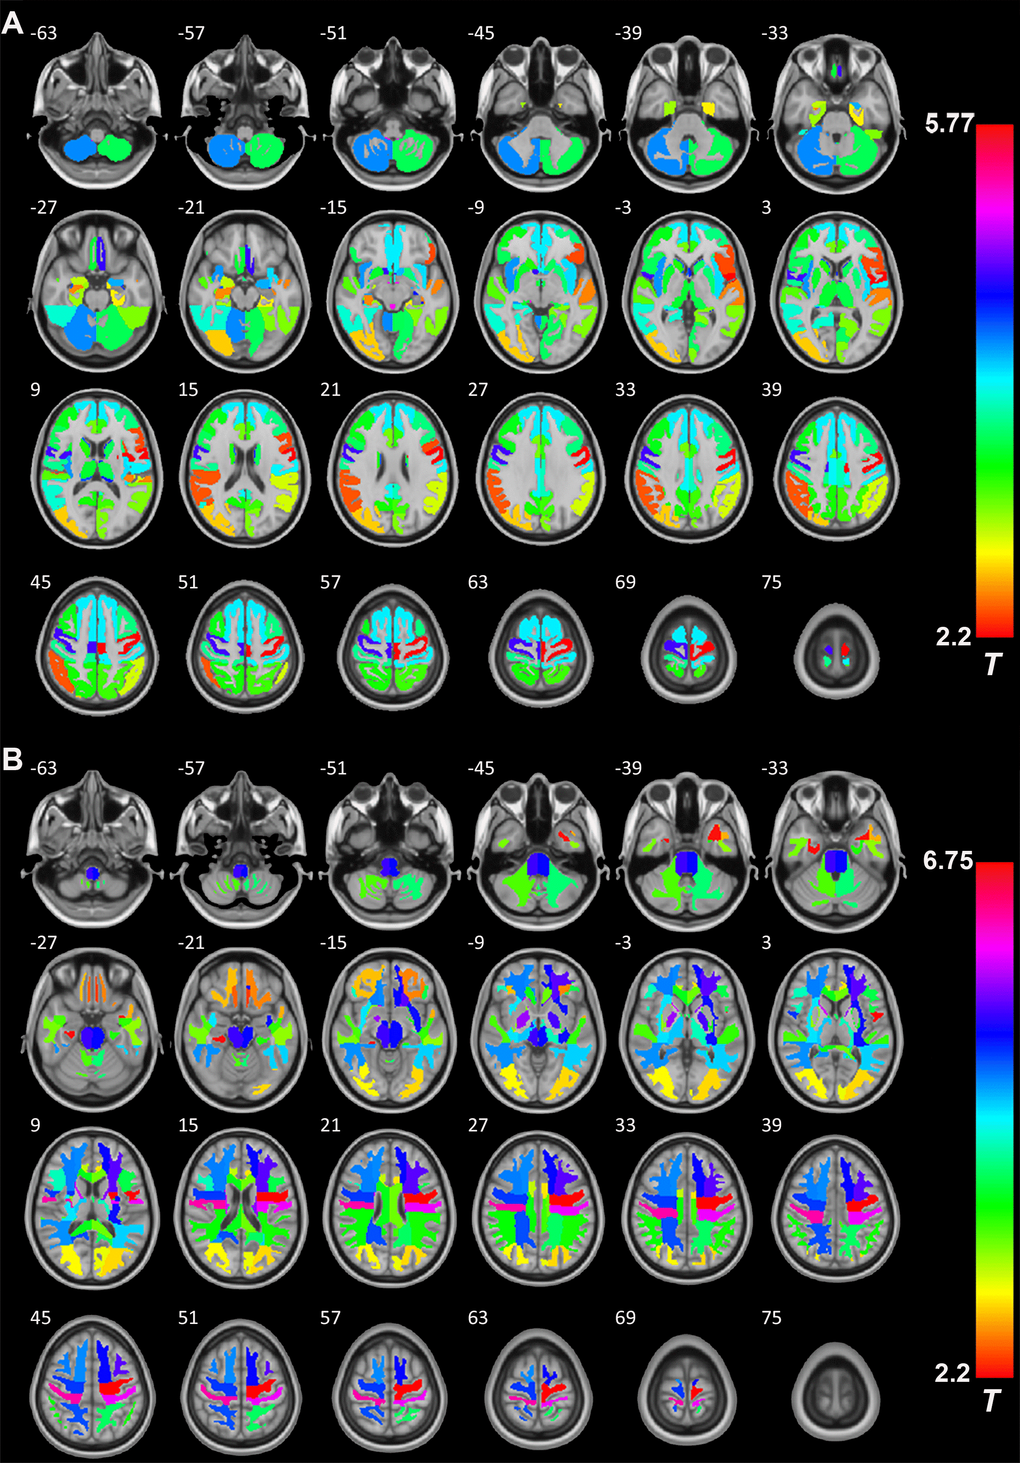
Figure 5.The role of GH/IGF-1 in the GMV and WMV of brain regions. (A) RBM analysis showing the increased GMV of 54 brain regions (Supplementary Table 1, from a total of 68 brain regions, Hammers' atlas) in patients with excess GH/IGF-1 production compared to that in HCs. (B) RBM analysis showing the white matter volume (WMV) of 54 brain regions (Supplementary Table 1, from a total of 68 brain regions, Hammers' atlas) increase in patients with excess GH/IGF-1 production compared to HCs. Significance was determined by uncorrected p < 0.05, using two-sample t-tests.