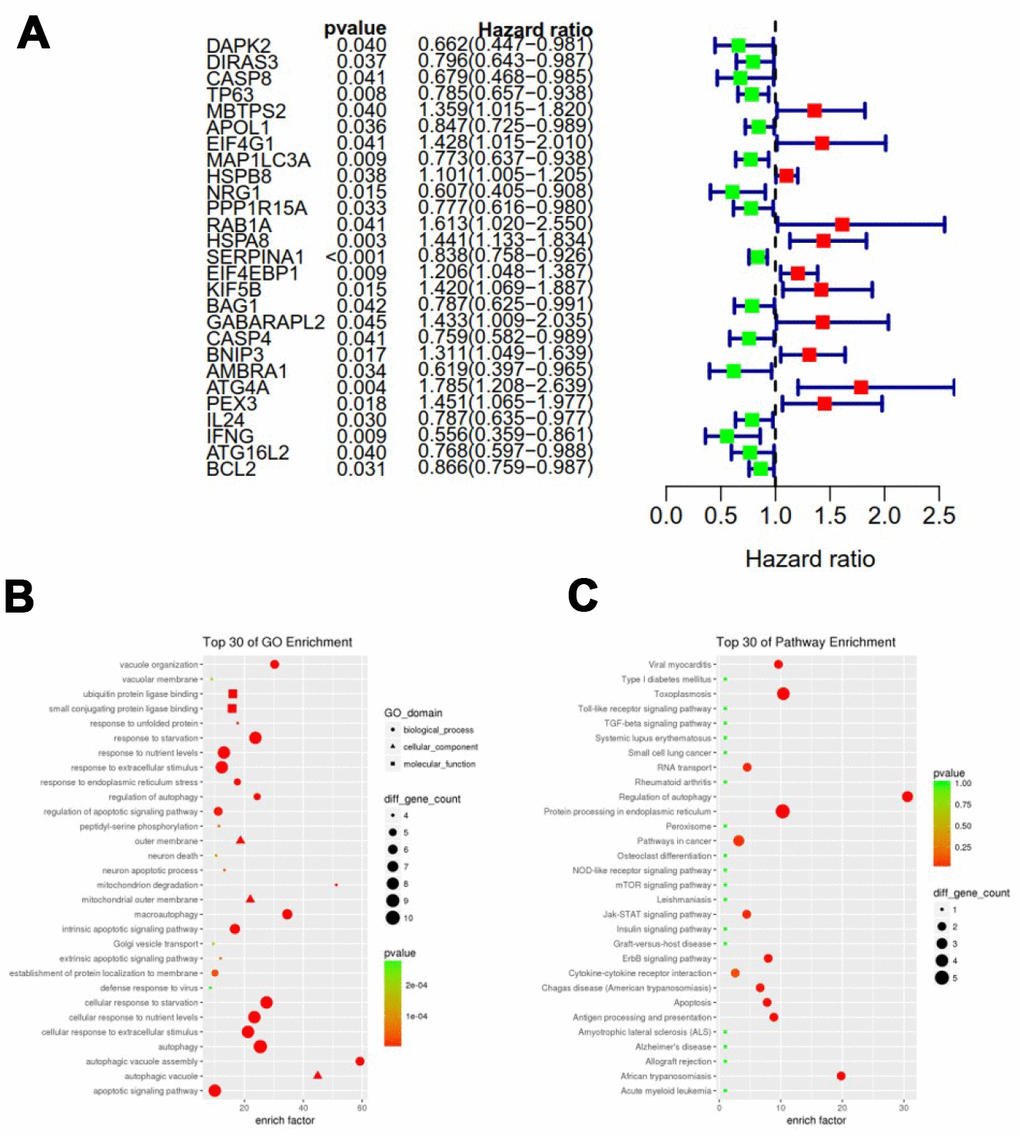
Figure 3.Expression profile and prognostic value of ARGs. (A) Risk ratio forest plot showed the prognostic value of the gene; (B) GO analysis revealed the biological processes and molecular functions involved in 27 prognostic-related ARGs; (C) KEGG shows the signaling pathways involved in 27 prognostic-related ARGs.