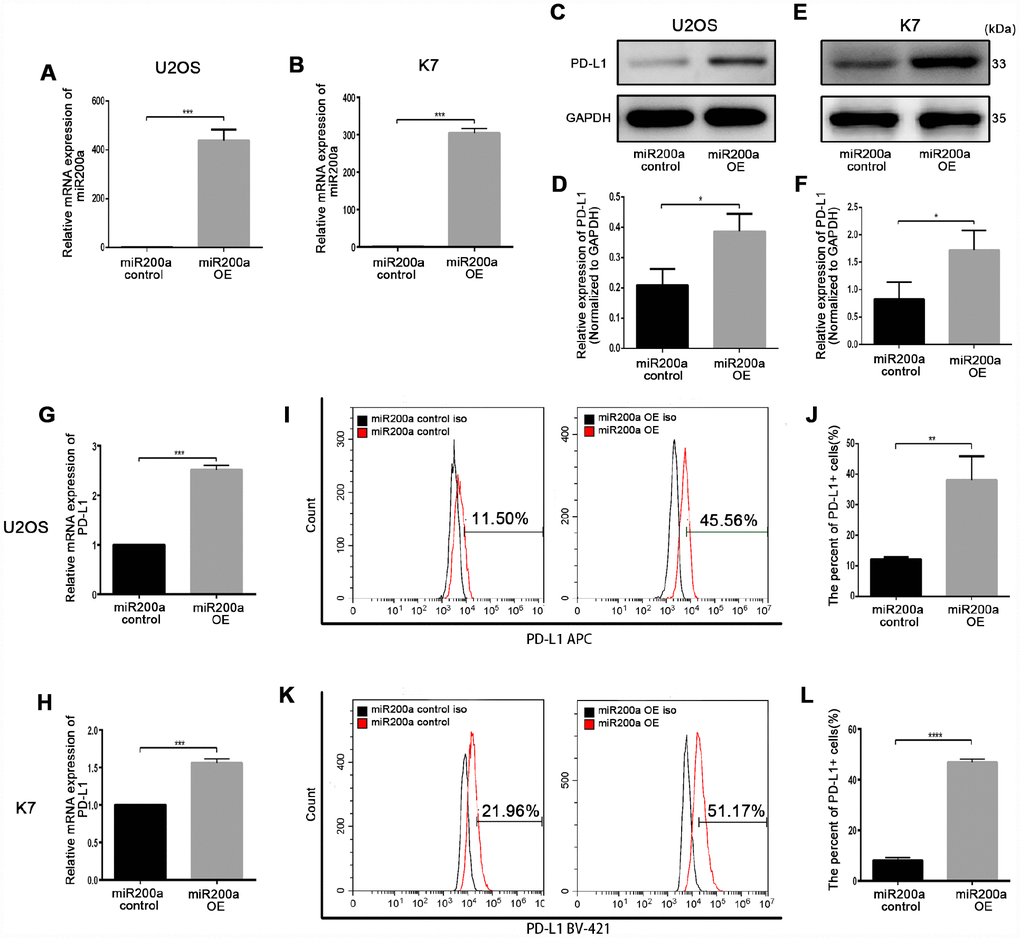
Figure 2.miR-200a up-regulated PD-L1 expression in U2OS and K7. (A) qRT-PCR analysis of miR-200a in U2OS miR-200a control and miR-200a OE. (B) qRT-PCR analysis of miR-200a in K7 miR-200a control and miR-200a OE. (C–D) Western blot analysis of PD-L1 in U2OS miR-200a control and miR-200a OE. (E–F) Western blot analysis of PD-L1 in K7 miR-200a control and miR-200a OE. (G) qRT-PCR analysis of PD-L1 in U2OS miR-200a control and miR-200a OE. (H) qRT-PCR analysis of PD-L1 in K7 miR-200a control and miR-200a OE. (I–J) Flow cytometry analysis of PD-L1 in U2OS miR-200a control and miR-200a OE. (K–L) Flow cytometry analysis of PD-L1 in K7 miR-200a control and miR-200a OE. *P<0.05, **P<0.01, ***P<0.001.