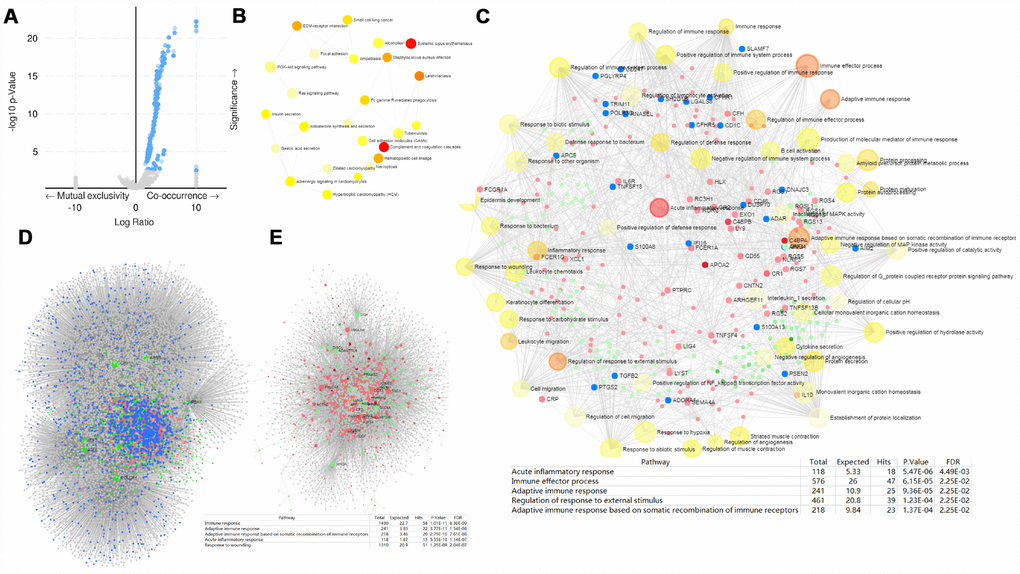
Figure 6.PRPF3 CNV co-occurrence profiles in HCC. (A) Volcano plot of co-occurrence genes along with PRPF3 amplification (AMP). (B) KEGG pathway analysis of significantly PRPF3 co-occurrence genes. (C) GO_BP terms of significantly PRPF3 co-occurrence genes. (D) The liver-specific protein-protein interaction (PPI) network of significantly PRPF3 co-occurrence genes. (E) Transcription factor-miRNA (TF-miRNA) coregulatory network of significantly PRPF3 co-occurrence genes.