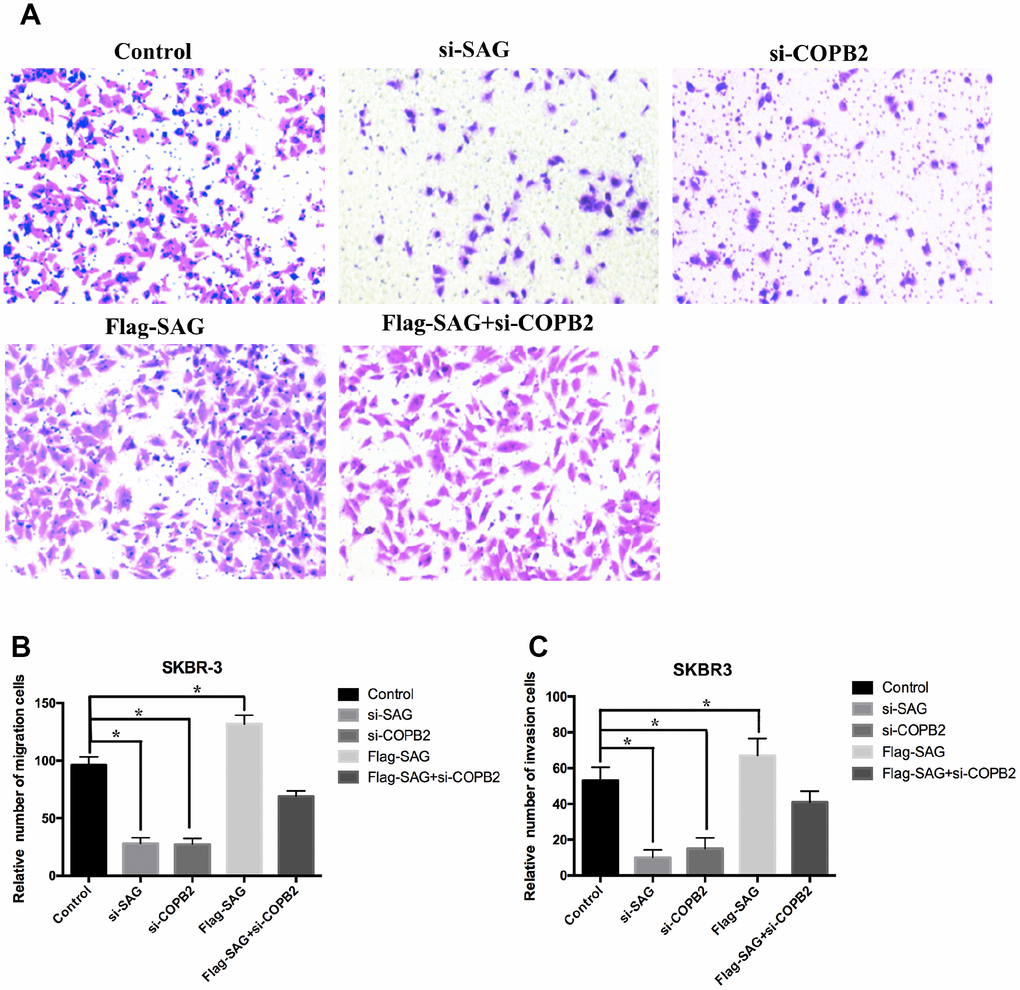
Figure 6.Downregulation of SAG or COPB2 inhibited breast cancer cell migration and invasion. (A) Representative images of migrated cells following transfection with the indicated genes. (B) Columns representing the relative number of migrated cells in the different groups. (C) Columns representing the relative number of invading cells in the different groups. (*P < 0.05).