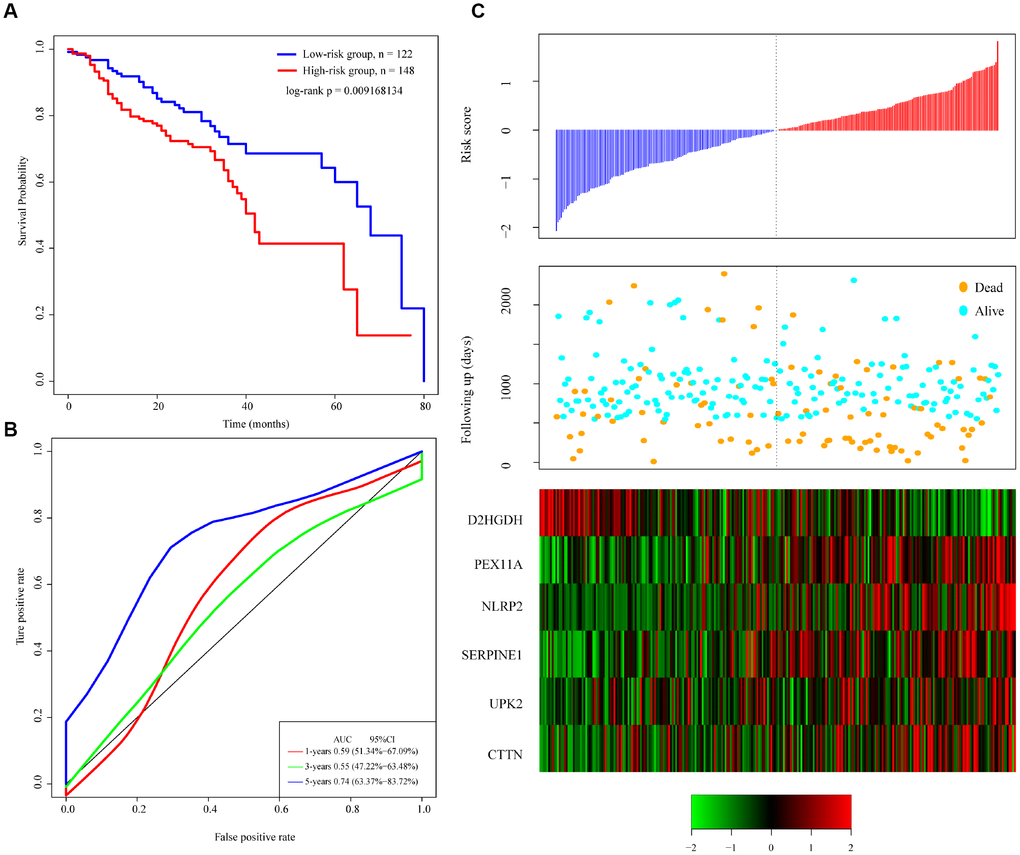
Figure 5.Performance of the 6-gene signature model with GEO data. (A) Kaplan-Meier survival curve distribution of 6-gene signature for the GSE65858 dataset. (B) ROC curve and AUC for the 6-gene signature classification. (C) Risk score, survival time, survival status, and expression of the 6-gene signature in the GSE65858 dataset.