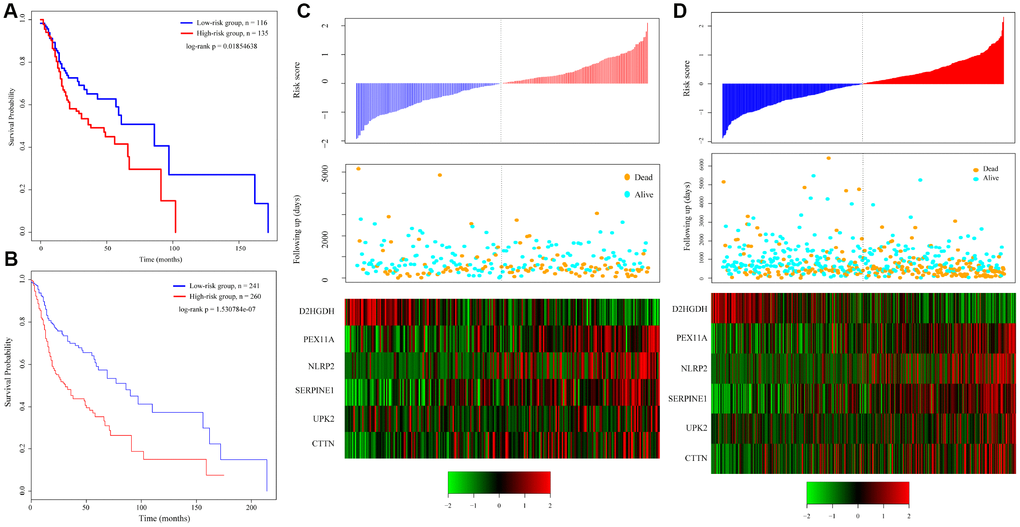
Figure 4.Relation between the 6-gene signature and cancer risk. (A) Kaplan-Meier curve for the test set sample. (B) Kaplan-Meier curve in all TCGA tumor samples. (C) Relationship between expression of the 6-gene signature and risk scores in test set samples. (D) Relationship between expression of the 6-gene signature and the risk score in all TCGA samples.