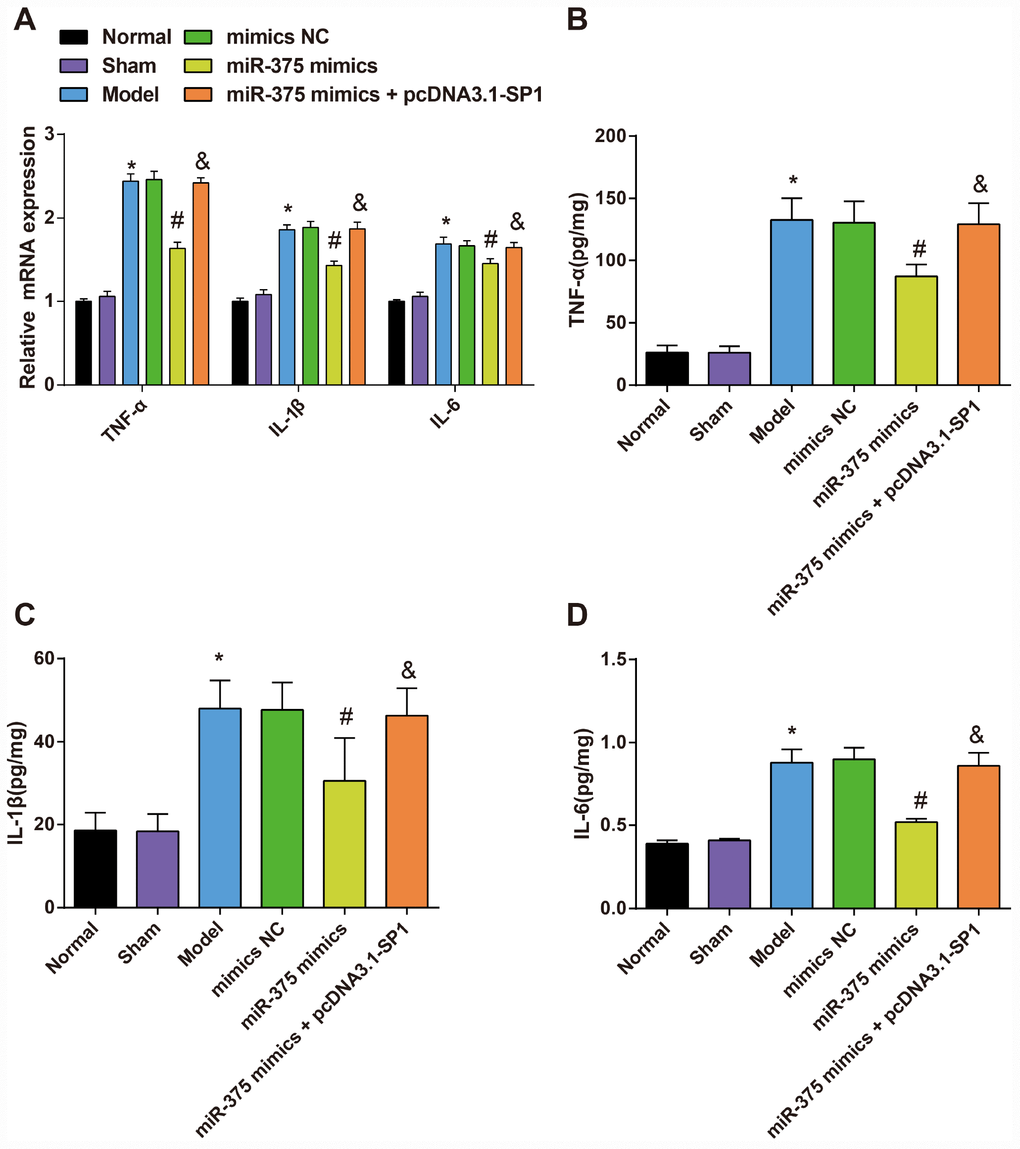
Figure 7.Expression of inflammatory factors TNF-α, IL-1β and IL-6 in substantia nigra of rats in each group (n = 12). (A) mRNA expression of inflammatory factors TNF-α, IL-1β and IL-6 in substantia nigra of rats in each group; (B–D) Expression of inflammatory factors TNF-α, IL-1β and IL-6 in substantia nigra of rats in each group; * P < 0.05 vs the normal group; # P < 0.05 vs the mimics NC group; & P < 0.05 vs the miR-375 mimics group. The measurement data were expressed as mean ± standard deviation and ANOVA was used for the comparison among multiple groups. After ANOVA analysis, the Tukey’s post-hoc test was used for pairwise comparison.