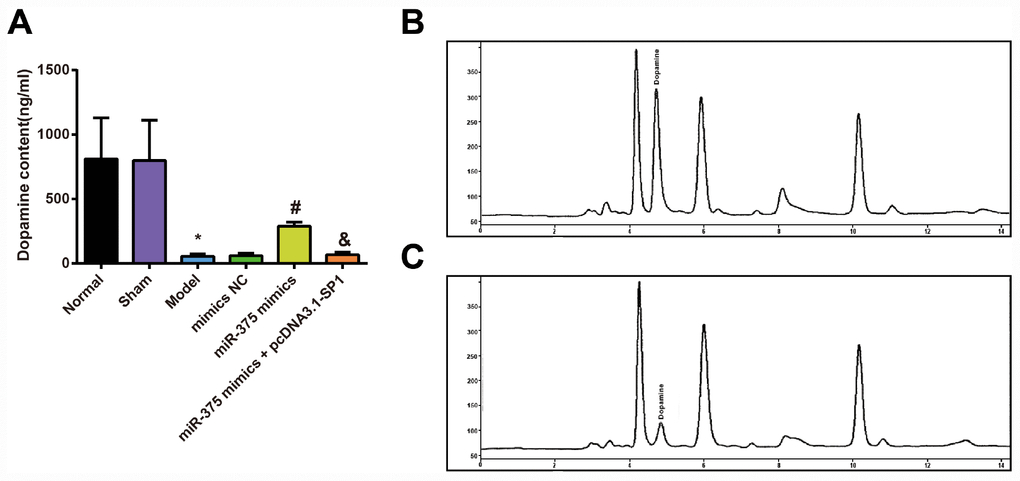
Figure 3.Detection of dopamine content in striatum of rats in each group (n = 12). (A) Dopamine content in the striatum of rats; (B) Dopamine content in the striatum of rats in the normal group was measured by HPLC; (C) Dopamine content in the striatum of rats in the model group was measured by HPLC; * P < 0.05 vs the normal group; # P < 0.05 vs the mimics NC group; & P < 0.05 vs the miR-375 mimics group. The measurement data were expressed as mean ± standard deviation and ANOVA was used for the comparison among multiple groups. After ANOVA analysis, the Tukey’s post-hoc test was used for pairwise comparison.