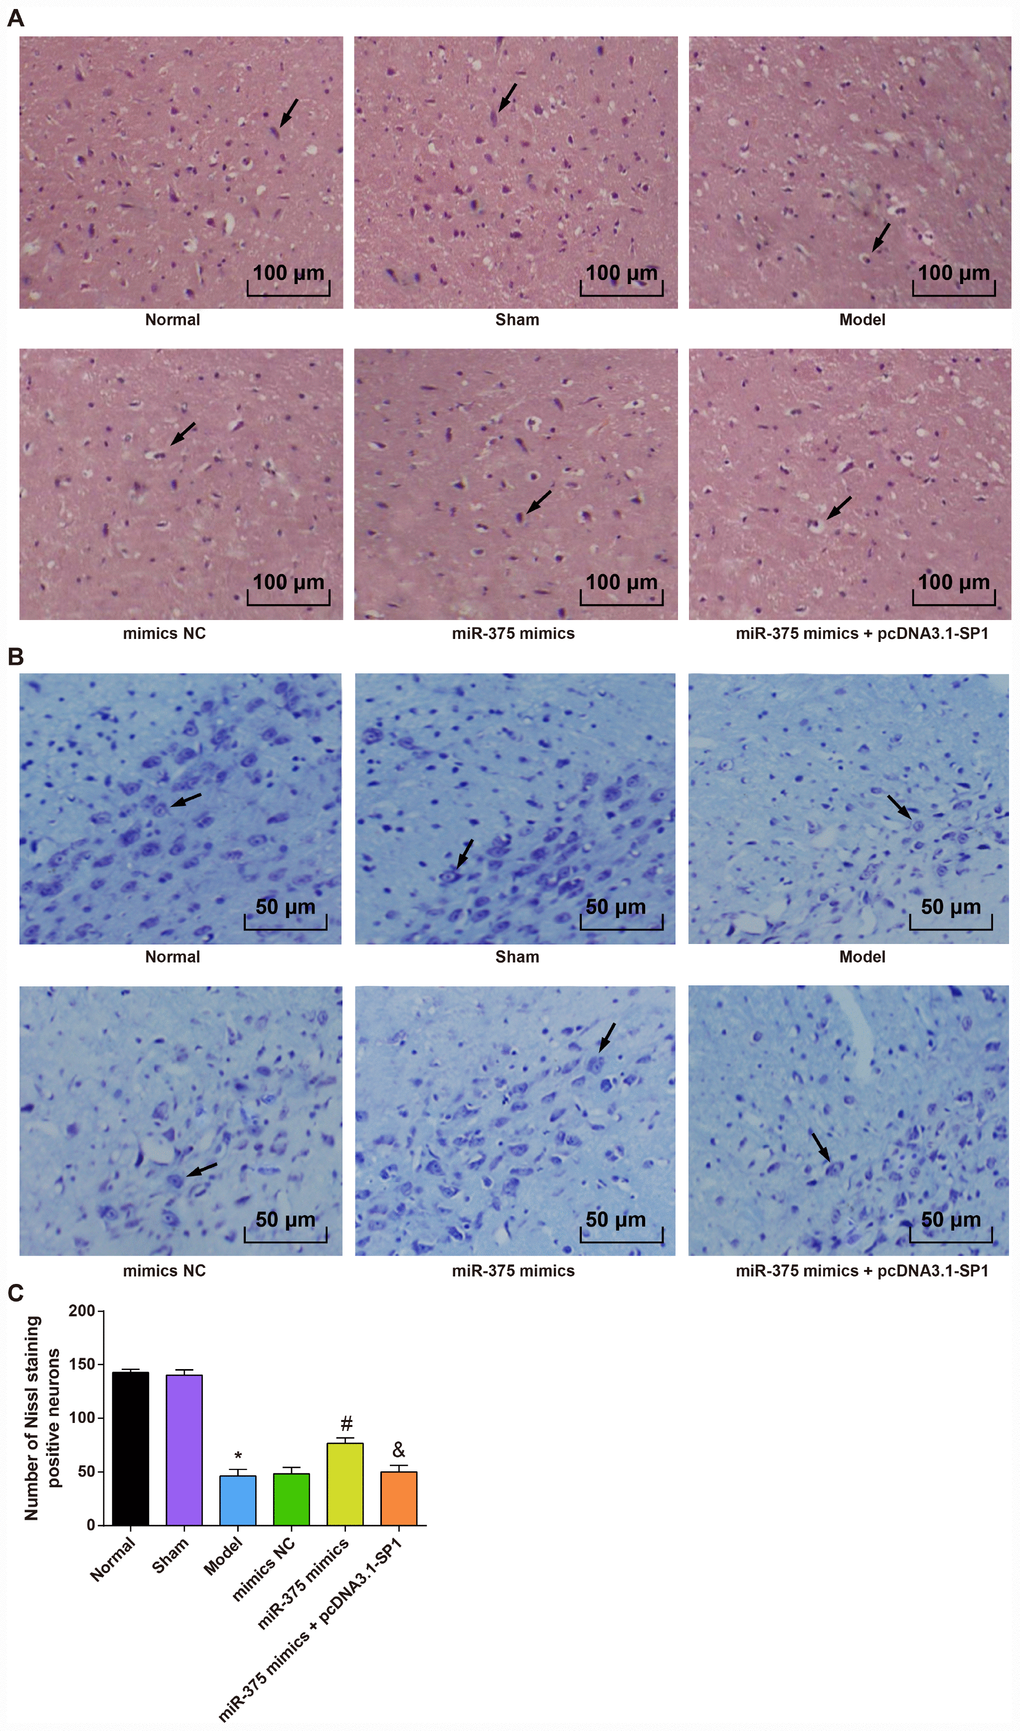
Figure 2.Morphological observation of rats with PD in each group (n = 12). (A) HE staining of substantia nigra in each group (× 100, the arrow indicates the neurons); (B) Nissl staining of substantia nigra in each group (× 200, the arrow indicates the Nissl positive neurons); (C) Comparison of the number of Neuron staining positive neurons in the substantia nigra of rats in each group; * P < 0.05 vs the normal group; # P < 0.05 vs the mimics NC group; & P < 0.05 vs the miR-375 mimics group. The measurement data were expressed as mean ± standard deviation and ANOVA was used for the comparison among multiple groups. After ANOVA analysis, the Tukey’s post-hoc test was used for pairwise comparison.