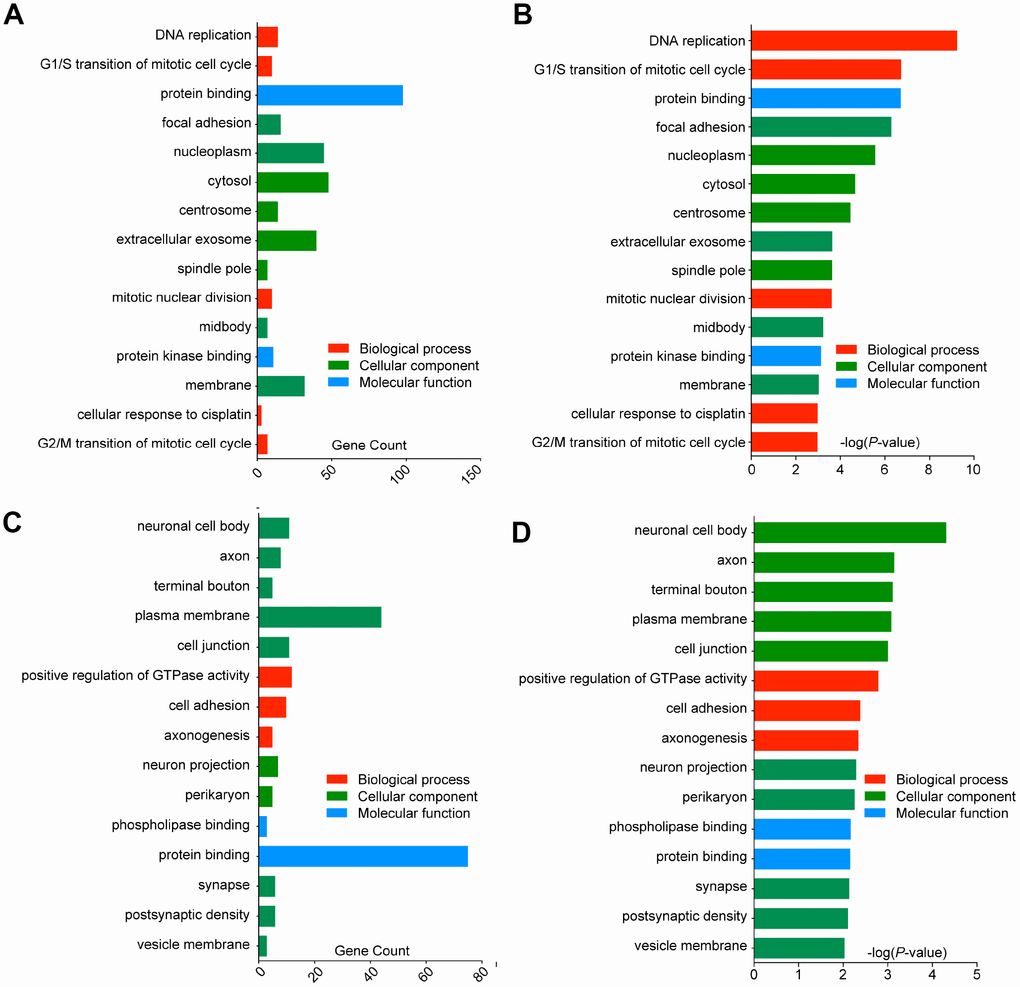
Figure 3.Gene Ontology analysis and significantly enriched GO terms of DEGs in GBM. The top 15 enriched DEGs of each group are shown (p < 0.05). (A) GO analysis classified the upregulated DEGs into 3 groups (molecular function, biological process and cellular component), gene counts of each GO terms were showed. (B) Significantly enriched GO terms of upregulated DEGs in GBM based on their p-value. (C) GO analysis classified the downregulated DEGs into 3 groups, gene counts of each GO terms were showed. (D) Significantly enriched GO terms of downregulated DEGs in GBM based on their p-value.